Articles

US November trade balance -56.8B vs -40.5B expected
425957 January 29, 2026 20:40 Forexlive Latest News Market News
- Prior was -29.4B
- Goods trade vs -56.57B prior
The big improvement in October data led to a jump in Q4 GDP forecasts.
Separately, the Q3 productivity report was released:
- Productivity vs 4.9% expected
- Unit labor costs vs -1.9% expected
The US International Trade in Goods and Services report, commonly known as the trade balance report, is a monthly economic indicator jointly released by the US Census Bureau and the Bureau of Economic Analysis. It measures the difference between the monetary value of exports and imports.
A positive value indicates a trade surplus, while a negative value—a consistent reality for the U.S. since 1975—represents a trade deficit. The report is a critical component for calculating gross domestic product and provides insight into consumer demand, manufacturing health, and the US dollar’s strength in global markets.
This article was written by Adam Button at investinglive.com.
US initial jobless claims 209K vs 205K expected
425956 January 29, 2026 20:40 Forexlive Latest News Market News
- Prior was 200K (revised to 210K)
- Continuing claims 1827K vs 1860K expected
- Prior 1849K (revised to 1865K)
It’s another great report, especially on the continuing claims side which could point to lower unemployment rate.
The US jobless claims have been pointing to a “low hire, low fire” labour market in 2025 as initial claims remained stable, while continuing claims reached new cycle highs.
More recently, the jobless claims data showed a notable improvement. In fact, initial claims fell to cycle lows and the uptrend in continuing claims started to reverse. It’s still early to say, but it looks like the labour market is getting better and better as business uncertainty eases.
WHAT DO JOBLESS CLAIMS MEASURE?
The US Jobless Claims indicator is a high-frequency economic report that tracks how many people are applying for state unemployment benefits. It is considered one of the most timely gauges of the health of the US labor market because it is released every Thursday at 8:30 a.m. ET, providing data that is only a few days old. The report, issued by the Department of Labor, is divided into two primary categories:
1. Initial Jobless Claims
The number of new (first-time) applications for unemployment insurance filed by individuals who have recently lost their jobs.
This is a leading indicator. It provides the earliest signal of a shifting economy; a steady rise in initial claims often precedes a recession, while a decline suggests the economy is starting to recover.
2. Continuing Jobless Claims
The number of people who have already filed an initial claim and are still receiving benefits.
This is a lagging or coincident indicator. It measures the “persistence” of unemployment. If continuing claims stay high, it means unemployed workers are having a hard time finding new jobs.
This article was written by Giuseppe Dellamotta at investinglive.com.
Trump blasts Powell again in saying US should have substantially lower rates by now
425955 January 29, 2026 20:25 Forexlive Latest News Market News
The full quote from Trump himself:
“Jerome “Too Late” Powell again refused to cut interest rates, even though he has absolutely no reason to keep them so high. He is hurting our Country, and its National Security. We should have a substantially lower rate now that even this moron admits inflation is no longer a problem or threat. He is costing America Hundreds of Billions of Dollar a year in totally unnecessary and uncalled for INTEREST EXPENSE. Because of the vast amounts of money flowing into our Country because of Tariffs, we should be paying the LOWEST INTEREST RATE OF ANY COUNTRY IN THE WORLD. Most of these countries are low interest rate paying cash machines, thought of as elegant, solid, and prime, only because the U.S.A. allows them to be. The Tariffs being charged to them, while bringing in $BILLIONS to us, still allows most of them to have a significant trade surplus, though much smaller, with our beautiful, formerly abused Country. In other words, I have been very nice, kind, and gentle to countries all over the World. With a mere flip of the pen, $BILLIONS more would come into the U.S.A., and these countries would have to go back to making money the old fashioned way, not on the back of America. I hope they all appreciate, although many don’t, what our great Country has done for them. The Fed should substantially lower interest rates, NOW! Tariffs have made America strong and powerful again, far stronger and more powerful than any other Nation. Commensurate with this strength, both financial and otherwise, WE SHOULD BE PAYING LOWER INTEREST RATES THAN ANY OTHER COUNTRY IN THE WORLD! Thank you for your attention to this matter. President DONALD J. TRUMP”
Him coming out to say this isn’t unexpected at all. In fact, the only surprising thing is that it took this long. You would think that he would have something ready to go at Powell already yesterday right after the Fed decision.
But yeah, there isn’t anything new from what he’s saying here. These are all points that Trump has made before in lambasting Powell for not bending to his political will.
It was also presumed that Trump might’ve used this to tee up an opportunity to announce his pick of the next Fed chair. But according to Bessent yesterday, that is likely to only come next week instead.
This article was written by Justin Low at investinglive.com.
investingLive European markets wrap: Dollar steadies after early drop, metals stay hot
425954 January 29, 2026 19:50 Forexlive Latest News Market News
Headlines:
- Dollar recovers some poise on the day, some light profit-taking in precious metals
- It’s not just Trump’s hawkish rhetoric against Iran pushing up oil prices
- European stocks rebound but DAX dragged down by SAP, Deutsche
- Plenty still to come for markets in wrapping up January
- BOC governor Macklem says there is no easy way to manage uncertainty from Trump policies
- Greg Michalowski to Lead Trading Workshops at iFX EXPO Dubai 2026
Markets:
- CAD leads, GBP lags on the day
- European equities higher, but DAX down on SAP, Deutsche; S&P 500 futures up 0.2%
- US 10-year yields flat at 4.249%
- Gold up 2.5% to $5,538
- WTI crude oil up 2.3% to $64.70
- Bitcoin down 1.6% to $87,878
It was a relatively quieter and calmer session, with markets settling down after the eventful happenings yesterday. The dollar was beaten down earlier in the day with yesterday’s respite seemingly short-lived. However, the greenback is recovering some poise today to keep nearly little changed with some profit-taking seen in gold and silver as well.
EUR/USD is facing some added resistance now near 1.2000 after ECB policymakers stepped in with some verbal interjections. The pair is flat at 1.1950 with the high earlier touching 1.1996. Meanwhile, USD/JPY is also flattish at 153.35 after holding closer to 153.00 at the start of the session. Tokyo intervention risks remain heightened, so do keep a watchful eye on this one.
Besides that, USD/CHF also bounced back from 0.7650 to be flat at 0.7680 now and AUD/USD is only marginally up by 0.1% to 0.7047 – down from a high of 0.7095 earlier in the day.
All of this comes as we see precious metals cool from the highs seen in the early hours of Europe. Gold moved up to near $5,600 again before the profit-taking hit and we saw a drop to $5,470 before coming back up to $5,538 again now. Meanwhile, silver hit fresh records of just above $120 before dropping back to $115 levels and then coming back up now to hold near the highs.
The volatility swings continue in the precious metals space and even if it may seem calmer today, conditions are still much more volatile than before.
Elsewhere, European equities are showing signs of a rebound after the drop yesterday. The CAC 40 index is up 0.5% with luxury stocks steadying after yesterday’s heavy selling on disappointing LVMH earnings. The DAX index is the only laggard with some red flags from SAP earnings, causing shares to be down by 11% – its steepest drop since 2020.
As for US futures, tech shares are holding firmer at the balance after key earnings yesterday from Microsoft, Meta, and Tesla. S&P 500 futures and Nasdaq futures are both up 0.2% on the day.
While things are settling down, we’re far from done with the week. There’s still plenty to focus on as seen below:
This article was written by Justin Low at investinglive.com.
Thursday 29th January 2026: Asian Markets Drift Lower as Middle East Tensions Rise and Wall Street Cues Remain Mixed
425953 January 29, 2026 18:40 ICMarkets Market News
Global Markets:
- Asian Stock Markets : Nikkei up 0.02%, Shanghai Composite down 0.10%, Hang Seng up 0.51% ASX down 0.35%
- Commodities : Gold at $5558.69 (4.07%) Silver at $117.433 (3.46%), Brent Oil at $68.09 (1.07%), WTI Oil at $64.02 (1.28%)
- Rates : US 10-year yield at 4.267, UK 10-year yield at 4.5470, Germany 10-year yield at 2.8538
News & Data:
- (CAD) Overnight Rate 2.25% to 2.25% expected
- (USD) Federal Funds Rate 3.75% to 3.75% expected
Markets Update:
Asian stock markets are trading mostly lower on Thursday, tracking mixed cues from Wall Street overnight, as investors remain cautious amid escalating geopolitical tensions in the Middle East. Sentiment has been weighed down by Iran’s rejection of nuclear talks under threat, even as a large U.S. naval armada approaches the region. The USS Abraham Lincoln carrier strike group is already deployed in West Asia, heightening fears of a broader conflict. Asian markets ended mixed in the previous session.
U.S. President Donald Trump issued a stern ultimatum to Iran, urging it to return to negotiations “before it is too late,” warning that any potential U.S. military action would be far more severe than the 2025 strikes. Iran responded by reaffirming its readiness for confrontation and claiming total control over the Strait of Hormuz, a crucial oil-shipping route. Support for Iran has also been pledged by Hezbollah and Yemen’s Houthi group, adding to regional uncertainty.
Meanwhile, the U.S. Federal Reserve left interest rates unchanged, as widely expected, citing continued uncertainty around the economic outlook. Market expectations suggest rates could remain on hold until after Fed Chair Jerome Powell steps down in May.
In Asia-Pacific markets, Australia’s S&P/ASX 200 is trading notably lower, dragged down by weakness in miners, financials, and technology stocks, despite gains in gold and energy shares. Japan’s Nikkei 225 is also marginally lower in a choppy session, with mixed sectoral performance.
Elsewhere in Asia, Indonesia is seeing sharp losses, while most other regional markets are modestly lower or flat. On Wall Street, U.S. stocks ended narrowly mixed, while European markets closed broadly lower. Meanwhile, crude oil prices surged, driven by heightened Middle East tensions and supply concerns.
Upcoming Events:
- 03:00 PM GMT – USD Unemployment Claims
The post Thursday 29th January 2026: Asian Markets Drift Lower as Middle East Tensions Rise and Wall Street Cues Remain Mixed first appeared on IC Markets | Official Blog.
IC Markets Global – Europe Fundamental Forecast | 29 January 2026
425952 January 29, 2026 18:40 ICMarkets Market News
IC Markets Global – Europe Fundamental Forecast | 29 January 2026
What happened in the Asia session?
The Asia session reflected Fed policy continuity, bolstering the USD against major pairs like JPY, EUR, GBP, and AUD, while gold’s record rally and oil’s uptrend highlighted haven demand; Hang Seng led equity gains, but impacts were most pronounced in FX and commodities per Saxo Bank’s quick take.
What does it mean for the Europe & US sessions?
Traders should focus on key macroeconomic releases and market-moving events as European and U.S. sessions open. Eurozone data at 10:00 GMT, including Economic Sentiment, Industrial Confidence, and Consumer Confidence (final), could sway EUR pairs amid ongoing ECB policy scrutiny. U.S. highlights at 13:30 EST feature Initial Jobless Claims (consensus ~202K), Trade Balance, and revisions to Nonfarm Productivity, followed by Factory Orders, offering labour market and manufacturing insights critical for USD strength.
The Dollar Index (DXY)
Key news events today
Unemployment Claims (1:30 pm GMT)
What can we expect from DXY today?
The US Dollar Index (DXY) dipped slightly to 96.1818, marking a 0.16% decline from the prior session amid ongoing weakness, with a 2.09% drop over the past month and 10.78% over the last year. This followed a rebound above 96.60 on January 28, driven by Treasury Secretary Scott Bessent’s affirmation of a strong-dollar policy and denial of US intervention in Japan’s yen markets.
Central Bank Notes:
- The Federal Open Market Committee (FOMC) is widely expected to hold the federal funds rate target range steady at 3.50%–3.75% at its January 27–28, 2026, meeting, marking the second consecutive pause after three 25-basis-point cuts in late 2025.
- The Committee continues to pursue maximum employment and 2% inflation goals, with the labour market remaining soft as the unemployment rate stood at 4.4% in December 2025 amid modest job gains of 50,000.
- Officials note balanced risks to growth and employment alongside sticky inflation, with CPI at 2.7% year-over-year in December 2025 and core PCE at 2.8% due to tariffs and housing pressures; headline PCE at 2.6%.
- Economic activity expanded robustly at 4.4% annualized in Q3 2025, with Q4 estimates around 5% per Atlanta Fed GDPNow, supported by consumer spending despite prior trade tensions and shutdown effects.
- December 2025’s Summary of Economic Projections forecasts 2025 unemployment at a median of 4.5%, 2026 GDP growth at 2.3%, and core PCE at 2.5% (down from prior 2.6%), with the dot plot signalling one more cut in 2026; January updates may reflect resilient Q4 growth.
- The Committee maintained its data-dependent approach, noting a stable but soft labour market and inflation above target, while holding rates steady at 3.50%-3.75%; dissents likely persist amid divisions on the pace of easing.
- The FOMC continues its adjusted quantitative tightening post-December 1, 2025, conclusion of prior program, with Treasury rolloff caps at $5 billion per month and agency MBS at $35 billion per month to maintain ample reserves.
- The next meeting is scheduled for 17 to 18 March 2026.
Next 24 Hours Bias
Medium Bearish
Gold (XAU)
Key news events today
Unemployment Claims (1:30 pm GMT)
What can we expect from Gold today?
Gold prices blistered past the $5,500 mark for the first time, hitting intraday peaks of $5,584/oz amid safe-haven buying spurred by US President Trump’s tariff warnings on Canada and South Korea, ongoing global conflicts, and the Fed’s rate pause, marking over 4% daily gains and continuing a remarkable 27% monthly surge that underscores gold’s role as a premier hedge in uncertain times.
Next 24 Hours Bias
Strong Bullish
The Euro (EUR)
Key news events today
No major news event
What can we expect from EUR today?
The euro’s strength reflects dollar vulnerabilities from trade disputes and Fed scrutiny, up 2.1% month-to-date after a 13% surge in 2025, though exporters face headwinds from costlier overseas sales. Broader eurozone efforts to boost security and growth add tailwinds, but no imminent challenge to dollar reserve status is expected.
Central Bank Notes:
- The Governing Council of the ECB kept the three key interest rates unchanged at its 4–5 January 2026 meeting, maintaining the main refinancing rate at 2.15%, the marginal lending facility at 2.40% and the deposit facility at 2.00%. This decision aligns with the assessment that the current stance supports medium-term price stability, as inflation edges below the 2% target while growth shows resilience amid balanced risks. Markets and commentary indicate value in holding steady, with no fixed path ahead given uncertainties in data.
- Price dynamics remain stable near target levels. Headline HICP inflation stood at 2.1% in November 2025, with projections for 1.9% in 2026 driven by base effects from energy and easing non-energy components. Services inflation persists somewhat elevated but trends toward moderation, alongside contained food pressures.
- December 2025 Eurosystem staff projections confirm headline inflation at 2.1% for 2025, declining to 1.9% in 2026 and 1.8% in 2027 before nearing 2% in 2028. Downside risks from soft producer prices and anchored expectations offset potential upsides from geopolitics or fiscal measures.
- Euro area GDP growth remains resilient at subdued levels, with Q3 2025 at 0.3% qoq and forecasts around 1.2-1.4% for 2025-2027. Surveys signal stabilization, bolstered by public investment and external demand against softer private spending.
- The labour market stays tight overall, with unemployment steady at 6.4% through October 2025, near historic lows and solid participation. Real incomes support consumption as inflation eases, with credit conditions aiding gradual household and firm expansion.
- Business sentiment reflects caution over US policy, trade tensions, and tariffs, tempered by easing supply chains and a competitive euro. Export sectors gain a modest lift, while domestic drivers like investment build momentum.
- The Governing Council will continue to make data-dependent decisions meeting by meeting, assessing inflation outlook, underlying trends, and transmission. Both hikes and cuts remain possible based on data, avoiding preset paths amid uncertainties.
- Balance sheet normalisation proceeds steadily, with APP and PEPP portfolios shrinking post-reinvestment halts, at a pace deemed suitable without market strain.
The next meeting is on 4 to 5 February 2026
Next 24 Hours Bias
Medium Bearish
The Swiss Franc (CHF)
Key news events today
No major news event
What can we expect from CHF today?
The Swiss Franc extended its robust performance, hovering near 11-year peaks against the USD at ~0.7657 due to persistent safe-haven demand, dollar debasement fears, and subdued Swiss inflation pressuring SNB policy, marking a 15.3% 12-month appreciation despite potential central bank pushback.
Central Bank Notes:
- At its 11 December 2025 monetary policy assessment, the Swiss National Bank (SNB) is widely expected to leave the policy rate unchanged at 0%, extending the pause that began in September as the Governing Board judges that current settings are sufficient to keep inflation near, but still below, its target while avoiding an unnecessary move into negative rates.
- Recent data show that the tentative rebound in Swiss inflation has stalled, with headline CPI easing from 0.1% year‑on‑year in October to 0.0% in November and core inflation slipping to about 0.4%, reinforcing the view that underlying price pressures remain very weak and that deflation risks, while contained, have not fully disappeared.
- The SNB’s conditional inflation forecast is likely to remain close to the September projections, with inflation still seen averaging roughly 0.2% in 2025, 0.5% in 2026, and 0.7% in 2027 under an unchanged policy rate path, though the latest CPI prints argue for a slightly lower near‑term profile and keep open the option of renewed easing if activity or prices weaken further.
- The global backdrop has deteriorated further, as continuing U.S. tariff actions and softer external demand weigh on world trade, while uncertainty in key European and U.S. markets for Swiss exports persists, leaving the SNB cautious about the growth outlook despite Switzerland’s relatively resilient domestic demand.
- Business and labour-market sentiment in export‑oriented manufacturing remains subdued, with firms reporting pressure on margins from the still‑strong franc and softer foreign orders, although the broader economy is still expected to grow at around 1–1.5% in 2025 and unemployment only drifting up gradually from low levels.
- The SNB continues to stress its willingness to act if deflation risks re‑emerge, reiterating that it can ease policy through renewed rate cuts or targeted foreign‑exchange intervention if necessary, while also highlighting its commitment to transparent communication, including the publication of detailed minutes from recent assessments and ongoing dialogue with international partners on FX policy
The next meeting is on 19 March 2026.
Next 24 Hours Bias
Strong Bullish
The Pound (GBP)
Key news events today
No major news event
What can we expect from GBP today?
The Pound remains cautiously bullish after a strong week, holding near multi-month highs versus a softer USD at around 1.37-1.3774, driven by upbeat UK retail inflation data (1.5% YoY, fastest in nearly two years) and robust prior economic indicators like PMI growth and sales, offsetting political headwinds and BoE hold expectations.
Central Bank Notes:
- The Bank of England’s Monetary Policy Committee (MPC) will meet on 18 December 2025, with the current Bank Rate standing at 4.00 per cent after being held in a close 5–4 vote at the 5 November meeting. Market pricing and analyst commentary point to a high risk of a 25‑basis‑point cut to 3.75 per cent, but this remains conditional on incoming inflation and labour‑market data, so the December note should be treated as pre‑decision guidance rather than an ex‑post summary.
- The BoE is expected to leave its quantitative tightening (QT) framework broadly unchanged through year‑end, maintaining the lower reduction pace in gilt holdings that was set earlier in 2025. Official communications still characterise the existing QT path as consistent with a restrictive stance, with policymakers stressing that balance‑sheet reduction will remain gradual and sensitive to market‑liquidity conditions.
- Headline CPI inflation eased to 3.6 per cent year‑on‑year in October 2025, down from 3.8 per cent in September, helped by softer energy and goods prices, though it remains almost twice the 2 per cent target. Underlying inflation pressures, particularly in services, have continued to moderate only slowly, so the MPC’s central projection still envisages inflation moving closer to, but not yet reaching, 3 per cent over the course of 2026, contingent on further normalisation in energy and wage dynamics.
- UK economic activity remains weak heading into the December meeting, with the labour market showing further signs of slackening. The unemployment rate has risen toward just above 5 per cent on the latest three‑month figures to October, while overall regular pay growth has slowed to around the mid‑4 per cent range, reinforcing the view that domestic cost pressures are gradually easing.
- External conditions continue to cloud the outlook, with fragile global growth and fluctuating commodity prices contributing to bouts of financial‑market volatility. The MPC has highlighted that renewed global energy or food price shocks could temporarily slow the pace of disinflation, but such risks are currently judged unlikely to derail the medium‑term downward trajectory for inflation if domestic demand stays subdued.
- The balance of risks around the inflation outlook remains finely poised. Downside risks are linked to persistently weak domestic demand and rising unemployment, while upside risks come from still‑elevated inflation expectations, sticky services inflation, and the possibility that structural changes in the labour market leave less slack than conventional indicators suggest.
- Overall, the MPC’s stance going into December is restrictive but increasingly open to a gradual easing cycle, with any rate cuts expected to be measured and data‑dependent. Policymakers have reiterated that the Bank Rate will need to stay in restrictive territory until they are confident inflation is on a sustainable path back to the 2 per cent target, and they have signalled that the profile of cuts, once started, is likely to be shallow rather than rapid.
- The next meeting is on 5 February 2026.
Next 24 Hours Bias
Medium Bullish
The Canadian Dollar (CAD)
Key news events today
No major news event
What can we expect from CAD today?
The Canadian Dollar edged firmer to around 1.3539 per USD, down 0.13% on the pair, driven by resilient oil prices and the Bank of Canada’s decision to hold rates at 2.25% amid sticky 2.4% inflation, though upside was limited by President Trump’s tariff threats over potential Canada-China trade ties.
Central Bank Notes:
- The Governing Council left the target for the overnight rate unchanged at 2.25% at its 28 January 2026 meeting, consistent with market expectations and reinforcing the pause in easing after the December hold. The Bank highlighted ongoing global trade uncertainties, including U.S. policy risks, but noted a steadier external environment with no immediate need for policy shifts amid fragile world demand.
- Uncertainty from U.S. tariffs continues to cloud business confidence, yet Canadian manufacturing PMI and export orders have stabilised further, with backlogs modestly increasing despite restrained investment. Recent data indicate goods exports, particularly energy, provided ongoing support, though firms remain selective in expansion plans.
- Canada’s economy maintained momentum into late 2025 and early 2026, with Q4 GDP estimates around 2.0-2.5% annualised after Q3’s 2.6% rebound, driven by crude oil exports, public spending, and partial service sector recovery. January flash indicators suggest a balanced start to Q1, though weather disruptions slightly tempered output gains.
- Services activity strengthened, with PMI holding above 50 and gains spreading to tech, tourism, and professional sectors; however, consumer services stayed uneven due to persistent high prices curbing non-essential spending despite wage growth. The Bank views this broadening as a sign of structural adjustment progressing.
- Housing markets edged firmer nationally, with resales and prices up modestly in December-January on lower rates and steady demand, though major cities face renewed pressures tempered by strict lending rules and affordability hurdles. The Bank expects this stabilisation to persist without overheating.
- CPI inflation held near 2.2% year-over-year in December 2025 and into January 2026 estimates, within the 1-3% band, while core metrics like CPI-median and trim eased toward 2.8%, signaling waning underlying pressures despite shelter and energy volatility. This supports the Bank’s confidence in target convergence.
- Officials reaffirmed the 2.25% rate as appropriate for sustaining 2% inflation and economic adjustment, with no near-term cuts anticipated absent growth or inflation shocks. Focus shifts to Q1 data durability, core trend sustainability, and trade policy clarity.
- The next meeting is on 25 March 2026.
Next 24 Hours Bias
Medium Bullish
Oil
Key news events today
No major news event
What can we expect from Oil today?
Stabilized with modest WTI gains near $62-63/bbl, offset by slight Brent dips around $67, as traders weighed US storm-induced supply cuts against a projected 2026 surplus of nearly 4% of global demand; geopolitical risks in Venezuela and the Middle East provided some support, but oversupply from non-OPEC producers dominated the bearish outlook.
Next 24 Hours Bias
Medium Bearish
The post IC Markets Global – Europe Fundamental Forecast | 29 January 2026 first appeared on IC Markets | Official Blog.
IC Markets Global – Asia Fundamental Forecast | 29 January 2026
425951 January 29, 2026 18:01 ICMarkets Market News
IC Markets Global – Asia Fundamental Forecast | 29 January 2026
What happened in the U.S. session?
The standout event in the U.S. overnight session was the Federal Reserve’s decision to hold rates at 3.5%-3.75%, highlighting firm economic footing but persistent inflation, which fueled volatility primarily in the U.S. dollar (down sharply), gold (up over 8%), and oil (up ~2.7%), while equity futures remained mixed ahead of tech earnings like Apple and amid sector swings in semis and health insurers.
What does it mean for the Asia Session?
Asian traders on Thursday, January 29, 2026, should monitor yen strength pressuring USD/JPY below 154 amid potential US-Japan intervention speculation, alongside President Trump’s tariff hikes on South Korean vehicles, pharmaceuticals, and lumber from 15-25%, boosting safe-haven gold and silver demand.
The Dollar Index (DXY)
Key news events today
Unemployment Claims (1:30 pm GMT)
What can we expect from DXY today?
The US Dollar faced ongoing pressure, rebounding modestly above 96.60 on the DXY amid mixed signals from the Federal Reserve’s hawkish policy hold and President Trump’s comments downplaying its recent weakness. Fed Chair Jerome Powell’s press conference emphasized a firm economic footing with stabilizing labor markets, though inflation remained elevated and Q4 growth was impacted by a government shutdown; rates stayed at 3.5%-3.75% in a 10-2 vote.
Central Bank Notes:
- The Federal Open Market Committee (FOMC) is widely expected to hold the federal funds rate target range steady at 3.50%–3.75% at its January 27–28, 2026, meeting, marking the second consecutive pause after three 25-basis-point cuts in late 2025.
- The Committee continues to pursue maximum employment and 2% inflation goals, with the labor market remaining soft as the unemployment rate stood at 4.4% in December 2025 amid modest job gains of 50,000.
- Officials note balanced risks to growth and employment alongside sticky inflation, with CPI at 2.7% year-over-year in December 2025 and core PCE at 2.8% due to tariffs and housing pressures; headline PCE at 2.6%.
- Economic activity expanded robustly at 4.4% annualized in Q3 2025, with Q4 estimates around 5% per Atlanta Fed GDPNow, supported by consumer spending despite prior trade tensions and shutdown effects.
- December 2025’s Summary of Economic Projections forecasts 2025 unemployment at a median of 4.5%, 2026 GDP growth at 2.3%, and core PCE at 2.5% (down from prior 2.6%), with the dot plot signaling one more cut in 2026; January updates may reflect resilient Q4 growth.
- The Committee maintained its data-dependent approach, noting a stable but soft labor market and inflation above target, while holding rates steady at 3.50%-3.75%; dissents likely persist amid divisions on the pace of easing.
- The FOMC continues its adjusted quantitative tightening post-December 1, 2025, conclusion of prior program, with Treasury rolloff caps at $5 billion per month and agency MBS at $35 billion per month to maintain ample reserves.
- The next meeting is scheduled for 17 to 18 March, 2026.
Next 24 Hours Bias
Medium Bearish
Gold (XAU)
Key news events today
Unemployment Claims (1:30 pm GMT)
What can we expect from Gold today?
Gold prices surged to record highs, driven by safe-haven demand amid global economic uncertainty, a weakening US dollar, and supportive global cues like ETF inflows and a softer rupee in India. Spot gold traded around $5,308 per ounce internationally, up over 2% from the prior day, while MCX gold in India jumped to ₹1.67 lakh per 10 grams for 24-carat, reflecting a weekly gain of about 13%.
Next 24 Hours Bias
Strong Bullish
The Australian Dollar (AUD)
Key news events today
No major news event
What can we expect from AUD today?
The AUD remains elevated near 0.7003, up 4.63% monthly and 12.41% yearly, as RBA hike odds rise against a dovish Fed outlook. A stronger AUD creates headwinds for exporters like beef producers. Geopolitical tensions and US data continue influencing flows, with consumer sentiment slipping on rate hike fears.
Central Bank Notes:
- The Reserve Bank of Australia held its cash rate steady at 3.60% at the November 2025 policy meeting, adopting a cautious tone amid a surprise uptick in inflation data for the September quarter. This marks the fourth consecutive pause since the 25 basis point cut in August. The Board attributed some of the inflation rise to temporary factors like higher petrol prices and council rates, but noted signs of more persistent pressures from consumer demand.
- Policymakers emphasized vigilance on inflation, with trimmed mean inflation expected to remain elevated in the near term before nearing the 2–3% target midpoint by mid-2027. Recent data showed underlying inflation staying above target until at least the second half of 2026, prompting upward revisions to forecasts. Capacity pressures are seen as slightly more pronounced than previously assessed, delaying any easing.
- Headline CPI for the September quarter exceeded expectations, driven partly by temporary items, while underlying measures signal ongoing stickiness. The shift to monthly CPI reporting, with the first full edition in November 2025, will enhance real-time inflation monitoring. Housing and services remain resilient contributors to price pressures.
- Domestic demand shows firmness in services alongside below-trend growth elsewhere, with capacity pressures not expected to ease significantly. The labor market is gradually softening, with unemployment projected to stabilize around 4.4%, though wage growth and productivity dynamics keep unit labor costs a concern. Household spending faces headwinds from high borrowing costs.
- Global risks include geopolitical tensions and commodity volatility, set against modestly revised-up world growth outlooks. The Board describes its policy as mildly restrictive and data-dependent, balancing inflation control with employment goals. No rate hike was considered despite the inflation surprise.
- Monetary policy remains mildly restrictive to address lingering price stability risks amid household and global vulnerabilities. Communications reaffirm the dual mandate of 2–3% inflation and full employment, with readiness to adjust based on incoming data.
- Market expectations point to the cash rate holding through early 2026, with a possible modest cut to 3.3% mid-year if inflation eases as forecast. The new monthly CPI data will be key for timely insights.
- Monetary policy remains mildly restrictive, balancing progress on price stability against vulnerabilities in household demand and global outlook. Board communications reaffirm a dual mandate: price stability and full employment, while underscoring readiness to respond should risks materialize sharply.
- Analysts generally expect the cash rate to remain at current levels through early 2026, with only modest cuts possible later in the year if inflation moderates. The new monthly CPI release (first full edition Nov 2025) will be watched closely for timely signals on price trends.
- The next meeting is on 2 to 3 February 2026.
Next 24 Hours Bias
Strong Bullish
The Kiwi Dollar (NZD)
Key news events today
No major news event
What can we expect from NZD today?
The NZD/USD pair retreated modestly toward 0.6000 after peaking at 0.6051 earlier in the week, supported by hotter-than-expected NZ inflation at 3.1% and a weakening US Dollar amid soft consumer confidence data (84.5 in January). Over the past month, the kiwi has gained 3.75% and 6.49% year-over-year, with forecasts eyeing 0.60 by quarter-end and 0.61 in 12 months, though no major events are confirmed for today beyond trade data.
Central Bank Notes:
- The Monetary Policy Committee (MPC) left the Official Cash Rate (OCR) unchanged at 2.25% at its 26 November 2025 meeting, following the widely anticipated 25-basis-point reduction from 2.50%, and signaled that policy is now firmly in stimulatory territory while keeping the option of further easing on the table if needed.
- The decision was again reached by consensus, with members judging that the cumulative 325 basis points of easing over the past year warranted a period of assessment, even as several emphasized a willingness to cut further should incoming data point to a more protracted downturn or renewed disinflationary pressures.
- Headline consumer price inflation is projected to hover near 3% in late 2025 before gradually easing toward the 2% midpoint of the 1–3% target band through 2026, supported by contained inflation expectations around 2.3% over the two-year horizon and an expected pickup in spare capacity.
- The MPC noted that domestic demand remains subdued but shows tentative signs of stabilisation, with softer household spending and construction only partially offset by improving services activity; nevertheless, policymakers still expect services inflation to ease as wage growth moderates and the labour market loosens further over the coming year.
- Financial conditions continue to ease as wholesale and retail borrowing rates reprice to the lower OCR, contributing to gradually rising mortgage approvals and improving housing-related sentiment, although broader business credit growth remains patchy and sensitive to uncertainty about the durability of the recovery.
- Recent data confirm that GDP momentum is weak but not deteriorating as sharply as earlier in 2025, with high-frequency indicators pointing to a shallow recovery from a low base and ongoing headwinds from elevated living costs and fragile confidence weighing on discretionary consumption and investment.
- The MPC reiterated that external risks remain skewed to the downside, particularly from softer Chinese demand and uncertainty around United States trade policy, but noted that a lower New Zealand dollar continues to provide some offset via improved export competitiveness and support for tradables inflation.
- Looking ahead to early 2026, the Committee maintained a mild easing bias, indicating that a further cut toward 2.00–2.10% cannot be ruled out if activity fails to gain traction or if inflation undershoots projections, but current forecasts envisage the OCR remaining near 2.25% for an extended period, provided inflation converges toward target and the recovery proceeds broadly as expected.
- The next meeting is on 18 February 2026.
Next 24 Hours Bias
Medium Bullish
The Japanese Yen (JPY)
Key news events today
Tokyo Core CPI y/y (11:30 pm GMT)
What can we expect from JPY today?
The yen clings to gains from BoJ-Fed divergence but faces headwinds from Japan’s fiscal concerns, aggressive spending plans, and a rebounding dollar ahead of Fed comments, keeping USD/JPY volatile around 153-154 with bears cautious due to intervention risks.
Central Bank Notes:
- The Policy Board of the Bank of Japan meets on 22–23 January 2026, with markets fully expecting the short-term policy rate to remain at 0.75%, following the December 2025 hike, as the bank assesses the impact of prior tightening while emphasizing gradual, data-dependent adjustments.
- The BOJ will continue targeting the uncollateralized overnight call rate around 0.75% and signal that future rate hikes depend on the effects of recent increases on bank lending, corporate financing, and economic activity, with some policymakers eyeing a possible move as early as April.
- JGB purchase tapering proceeds on schedule, with outright purchases reduced by ¥400 billion per quarter through March 2026, then ¥200 billion per quarter from April to June 2026, aiming for around ¥2 trillion monthly in Q1 2027, with flexibility if market conditions worsen.
- Japan’s economy showed recovery signs after the Q3 2025 contraction, with Q4 2025 GDP growth estimated positively amid export strength, though business sentiment among manufacturers softened to a six-month low of +7 in January 2026 due to weaker overseas demand.
- Core consumer inflation (excluding fresh food) eased to 2.3% year-on-year in December 2025 Tokyo CPI, down from 2.8-3.0% peaks earlier, while core-core (excluding fresh food and energy) stood at 2.6%, both above the 2% target but with moderating cost pressures.
- Near-term input costs continue easing from faded import surges, but services inflation and steady wage gains with early 2026 negotiations targeting 5% hikes sustain price momentum; medium-term inflation expectations remain anchored above 2%, tilting upside risks.
- In the coming quarters, real growth may moderate below potential amid tighter conditions and yen weakness, but accommodative real rates, real wage gains, and fiscal support are poised to bolster private consumption and investment recovery.
- Medium-term, stabilizing overseas demand and tight labor markets should drive wage growth and keep core inflation gradually around or above 2%, allowing cautious rate normalization if financial conditions stay supportive.
- The next meeting is scheduled for April 2026.
Next 24 Hours Bias
Strong Bullish
Oil
Key news events today
No major news event
What can we expect from Oil today?
Oil markets show resilience amid ongoing U.S. winter storm disruptions and escalating geopolitical tensions, particularly involving U.S. President Donald Trump’s warnings to Iran, with an aircraft carrier dispatched to the Middle East. Brent crude hovered around $67-68 per barrel and WTI near $62-63, supported by U.S. production outages of up to 700,000-250,000 bpd in regions like Permian, Bakken, and Texas, though recovery is expected by January 30.
Next 24 Hours Bias
Weak Bearish
The post IC Markets Global – Asia Fundamental Forecast | 29 January 2026 first appeared on IC Markets | Official Blog.
IC Markets Global – Asia Fundamental Forecast | 29 January 2026
425950 January 29, 2026 18:01 ICMarkets Market News
IC Markets Global – Asia Fundamental Forecast | 29 January 2026
What happened in the U.S. session?
The standout event in the U.S. overnight session was the Federal Reserve’s decision to hold rates at 3.5%-3.75%, highlighting firm economic footing but persistent inflation, which fueled volatility primarily in the U.S. dollar (down sharply), gold (up over 8%), and oil (up ~2.7%), while equity futures remained mixed ahead of tech earnings like Apple and amid sector swings in semis and health insurers.
What does it mean for the Asia Session?
Asian traders on Thursday, January 29, 2026, should monitor yen strength pressuring USD/JPY below 154 amid potential US-Japan intervention speculation, alongside President Trump’s tariff hikes on South Korean vehicles, pharmaceuticals, and lumber from 15-25%, boosting safe-haven gold and silver demand.
The Dollar Index (DXY)
Key news events today
Unemployment Claims (1:30 pm GMT)
What can we expect from DXY today?
The US Dollar faced ongoing pressure, rebounding modestly above 96.60 on the DXY amid mixed signals from the Federal Reserve’s hawkish policy hold and President Trump’s comments downplaying its recent weakness. Fed Chair Jerome Powell’s press conference emphasized a firm economic footing with stabilizing labor markets, though inflation remained elevated and Q4 growth was impacted by a government shutdown; rates stayed at 3.5%-3.75% in a 10-2 vote.
Central Bank Notes:
- The Federal Open Market Committee (FOMC) is widely expected to hold the federal funds rate target range steady at 3.50%–3.75% at its January 27–28, 2026, meeting, marking the second consecutive pause after three 25-basis-point cuts in late 2025.
- The Committee continues to pursue maximum employment and 2% inflation goals, with the labor market remaining soft as the unemployment rate stood at 4.4% in December 2025 amid modest job gains of 50,000.
- Officials note balanced risks to growth and employment alongside sticky inflation, with CPI at 2.7% year-over-year in December 2025 and core PCE at 2.8% due to tariffs and housing pressures; headline PCE at 2.6%.
- Economic activity expanded robustly at 4.4% annualized in Q3 2025, with Q4 estimates around 5% per Atlanta Fed GDPNow, supported by consumer spending despite prior trade tensions and shutdown effects.
- December 2025’s Summary of Economic Projections forecasts 2025 unemployment at a median of 4.5%, 2026 GDP growth at 2.3%, and core PCE at 2.5% (down from prior 2.6%), with the dot plot signaling one more cut in 2026; January updates may reflect resilient Q4 growth.
- The Committee maintained its data-dependent approach, noting a stable but soft labor market and inflation above target, while holding rates steady at 3.50%-3.75%; dissents likely persist amid divisions on the pace of easing.
- The FOMC continues its adjusted quantitative tightening post-December 1, 2025, conclusion of prior program, with Treasury rolloff caps at $5 billion per month and agency MBS at $35 billion per month to maintain ample reserves.
- The next meeting is scheduled for 17 to 18 March, 2026.
Next 24 Hours Bias
Medium Bearish
Gold (XAU)
Key news events today
Unemployment Claims (1:30 pm GMT)
What can we expect from Gold today?
Gold prices surged to record highs, driven by safe-haven demand amid global economic uncertainty, a weakening US dollar, and supportive global cues like ETF inflows and a softer rupee in India. Spot gold traded around $5,308 per ounce internationally, up over 2% from the prior day, while MCX gold in India jumped to ₹1.67 lakh per 10 grams for 24-carat, reflecting a weekly gain of about 13%.
Next 24 Hours Bias
Strong Bullish
The Australian Dollar (AUD)
Key news events today
No major news event
What can we expect from AUD today?
The AUD remains elevated near 0.7003, up 4.63% monthly and 12.41% yearly, as RBA hike odds rise against a dovish Fed outlook. A stronger AUD creates headwinds for exporters like beef producers. Geopolitical tensions and US data continue influencing flows, with consumer sentiment slipping on rate hike fears.
Central Bank Notes:
- The Reserve Bank of Australia held its cash rate steady at 3.60% at the November 2025 policy meeting, adopting a cautious tone amid a surprise uptick in inflation data for the September quarter. This marks the fourth consecutive pause since the 25 basis point cut in August. The Board attributed some of the inflation rise to temporary factors like higher petrol prices and council rates, but noted signs of more persistent pressures from consumer demand.
- Policymakers emphasized vigilance on inflation, with trimmed mean inflation expected to remain elevated in the near term before nearing the 2–3% target midpoint by mid-2027. Recent data showed underlying inflation staying above target until at least the second half of 2026, prompting upward revisions to forecasts. Capacity pressures are seen as slightly more pronounced than previously assessed, delaying any easing.
- Headline CPI for the September quarter exceeded expectations, driven partly by temporary items, while underlying measures signal ongoing stickiness. The shift to monthly CPI reporting, with the first full edition in November 2025, will enhance real-time inflation monitoring. Housing and services remain resilient contributors to price pressures.
- Domestic demand shows firmness in services alongside below-trend growth elsewhere, with capacity pressures not expected to ease significantly. The labor market is gradually softening, with unemployment projected to stabilize around 4.4%, though wage growth and productivity dynamics keep unit labor costs a concern. Household spending faces headwinds from high borrowing costs.
- Global risks include geopolitical tensions and commodity volatility, set against modestly revised-up world growth outlooks. The Board describes its policy as mildly restrictive and data-dependent, balancing inflation control with employment goals. No rate hike was considered despite the inflation surprise.
- Monetary policy remains mildly restrictive to address lingering price stability risks amid household and global vulnerabilities. Communications reaffirm the dual mandate of 2–3% inflation and full employment, with readiness to adjust based on incoming data.
- Market expectations point to the cash rate holding through early 2026, with a possible modest cut to 3.3% mid-year if inflation eases as forecast. The new monthly CPI data will be key for timely insights.
- Monetary policy remains mildly restrictive, balancing progress on price stability against vulnerabilities in household demand and global outlook. Board communications reaffirm a dual mandate: price stability and full employment, while underscoring readiness to respond should risks materialize sharply.
- Analysts generally expect the cash rate to remain at current levels through early 2026, with only modest cuts possible later in the year if inflation moderates. The new monthly CPI release (first full edition Nov 2025) will be watched closely for timely signals on price trends.
- The next meeting is on 2 to 3 February 2026.
Next 24 Hours Bias
Strong Bullish
The Kiwi Dollar (NZD)
Key news events today
No major news event
What can we expect from NZD today?
The NZD/USD pair retreated modestly toward 0.6000 after peaking at 0.6051 earlier in the week, supported by hotter-than-expected NZ inflation at 3.1% and a weakening US Dollar amid soft consumer confidence data (84.5 in January). Over the past month, the kiwi has gained 3.75% and 6.49% year-over-year, with forecasts eyeing 0.60 by quarter-end and 0.61 in 12 months, though no major events are confirmed for today beyond trade data.
Central Bank Notes:
- The Monetary Policy Committee (MPC) left the Official Cash Rate (OCR) unchanged at 2.25% at its 26 November 2025 meeting, following the widely anticipated 25-basis-point reduction from 2.50%, and signaled that policy is now firmly in stimulatory territory while keeping the option of further easing on the table if needed.
- The decision was again reached by consensus, with members judging that the cumulative 325 basis points of easing over the past year warranted a period of assessment, even as several emphasized a willingness to cut further should incoming data point to a more protracted downturn or renewed disinflationary pressures.
- Headline consumer price inflation is projected to hover near 3% in late 2025 before gradually easing toward the 2% midpoint of the 1–3% target band through 2026, supported by contained inflation expectations around 2.3% over the two-year horizon and an expected pickup in spare capacity.
- The MPC noted that domestic demand remains subdued but shows tentative signs of stabilisation, with softer household spending and construction only partially offset by improving services activity; nevertheless, policymakers still expect services inflation to ease as wage growth moderates and the labour market loosens further over the coming year.
- Financial conditions continue to ease as wholesale and retail borrowing rates reprice to the lower OCR, contributing to gradually rising mortgage approvals and improving housing-related sentiment, although broader business credit growth remains patchy and sensitive to uncertainty about the durability of the recovery.
- Recent data confirm that GDP momentum is weak but not deteriorating as sharply as earlier in 2025, with high-frequency indicators pointing to a shallow recovery from a low base and ongoing headwinds from elevated living costs and fragile confidence weighing on discretionary consumption and investment.
- The MPC reiterated that external risks remain skewed to the downside, particularly from softer Chinese demand and uncertainty around United States trade policy, but noted that a lower New Zealand dollar continues to provide some offset via improved export competitiveness and support for tradables inflation.
- Looking ahead to early 2026, the Committee maintained a mild easing bias, indicating that a further cut toward 2.00–2.10% cannot be ruled out if activity fails to gain traction or if inflation undershoots projections, but current forecasts envisage the OCR remaining near 2.25% for an extended period, provided inflation converges toward target and the recovery proceeds broadly as expected.
- The next meeting is on 18 February 2026.
Next 24 Hours Bias
Medium Bullish
The Japanese Yen (JPY)
Key news events today
Tokyo Core CPI y/y (11:30 pm GMT)
What can we expect from JPY today?
The yen clings to gains from BoJ-Fed divergence but faces headwinds from Japan’s fiscal concerns, aggressive spending plans, and a rebounding dollar ahead of Fed comments, keeping USD/JPY volatile around 153-154 with bears cautious due to intervention risks.
Central Bank Notes:
- The Policy Board of the Bank of Japan meets on 22–23 January 2026, with markets fully expecting the short-term policy rate to remain at 0.75%, following the December 2025 hike, as the bank assesses the impact of prior tightening while emphasizing gradual, data-dependent adjustments.
- The BOJ will continue targeting the uncollateralized overnight call rate around 0.75% and signal that future rate hikes depend on the effects of recent increases on bank lending, corporate financing, and economic activity, with some policymakers eyeing a possible move as early as April.
- JGB purchase tapering proceeds on schedule, with outright purchases reduced by ¥400 billion per quarter through March 2026, then ¥200 billion per quarter from April to June 2026, aiming for around ¥2 trillion monthly in Q1 2027, with flexibility if market conditions worsen.
- Japan’s economy showed recovery signs after the Q3 2025 contraction, with Q4 2025 GDP growth estimated positively amid export strength, though business sentiment among manufacturers softened to a six-month low of +7 in January 2026 due to weaker overseas demand.
- Core consumer inflation (excluding fresh food) eased to 2.3% year-on-year in December 2025 Tokyo CPI, down from 2.8-3.0% peaks earlier, while core-core (excluding fresh food and energy) stood at 2.6%, both above the 2% target but with moderating cost pressures.
- Near-term input costs continue easing from faded import surges, but services inflation and steady wage gains with early 2026 negotiations targeting 5% hikes sustain price momentum; medium-term inflation expectations remain anchored above 2%, tilting upside risks.
- In the coming quarters, real growth may moderate below potential amid tighter conditions and yen weakness, but accommodative real rates, real wage gains, and fiscal support are poised to bolster private consumption and investment recovery.
- Medium-term, stabilizing overseas demand and tight labor markets should drive wage growth and keep core inflation gradually around or above 2%, allowing cautious rate normalization if financial conditions stay supportive.
- The next meeting is scheduled for April 2026.
Next 24 Hours Bias
Strong Bullish
Oil
Key news events today
No major news event
What can we expect from Oil today?
Oil markets show resilience amid ongoing U.S. winter storm disruptions and escalating geopolitical tensions, particularly involving U.S. President Donald Trump’s warnings to Iran, with an aircraft carrier dispatched to the Middle East. Brent crude hovered around $67-68 per barrel and WTI near $62-63, supported by U.S. production outages of up to 700,000-250,000 bpd in regions like Permian, Bakken, and Texas, though recovery is expected by January 30.
Next 24 Hours Bias
Weak Bearish
The post IC Markets Global – Asia Fundamental Forecast | 29 January 2026 first appeared on IC Markets | Official Blog.
Thursday 29th January 2026: Technical Outlook and Review
425916 January 29, 2026 18:00 ICMarkets Market News
DXY (U.S. Dollar Index):
Potential Direction: Bearish
Overall momentum of the chart: Bearish
The price could see a short-term pullback toward the pivot before continuing its bearish move down toward the 1st support.
Pivot: 96.57
Supporting reasons: Identified as a pullback resistance, where selling pressures could intensify and potentially cap any upward retracement.
1st support: 94.95
Supporting reasons: Identified as a support that aligns with the 361.8% Fibonacci extension, indicating a potential area where the price could again stabilize.
1st resistance: 97.74
Supporting reasons: Identified as a pullback resistance, indicating a potential area that could halt any further upward movement
EUR/USD:
Potential Direction: Bullish
Overall momentum of the chart: Bullish
The price could see a short-term pullback toward the pivot before continuing its bullish move toward the 1st resistance
Pivot: 1.1875
Supporting reasons: Identified as a pullback support, where renewed buying pressure could emerge to push the price higher.
1st support: 1.1805
Supporting reasons: Identified as a pullback support, indicating a potential level where the price could stabilize once again.
1st resistance: 1.2092
Supporting reasons: Identified as a resistance that aligns with the 161.8% Fibonacci projection, indicating a potential level that could cap further upward movement.
EUR/JPY:
Potential Direction: Bearish
Overall momentum of the chart: Bullish
The price could see a short-term pullback toward the pivot before continuing its bearish move down toward the 1st support.
Pivot: 183.52
Supporting reasons: Identified as a pullback resistance that aligns with the 38.2% Fibonacci retracement, where selling pressures could intensify and potentially cap any upward retracement.
1st support: 181.72
Supporting reasons: Identified as an overlap support, indicating a potential area where the price could again stabilize.
1st resistance: 184.82
Supporting reasons: Identified as a pullback resistance that aligned with the 61.8% Fibonacci retracement, indicating a potential level that could cap further upward movement.
EUR/GBP:
Potential Direction: Bearish
Overall momentum of the chart: Bullish
The price could see a short-term pullback toward the pivot before continuing its bearish move down toward the 1st support.
Pivot: 0.8695
Supporting reasons: Identified as an overlap resistance, where selling pressures could intensify and potentially cap any upward retracement.
1st support: 0.8643
Supporting reasons: Identified as a multi-swing low support, indicating a potential area where the price could stabilize once more.
1st resistance: 0.8745
Supporting reasons: Identified as an overlap resistance, indicating a potential level that could cap further upward movement.
GBP/USD:
Potential Direction: Bullish
Overall momentum of the chart: Bullish
The price could see a short-term pullback toward the pivot before rising again toward the 1st resistance.
Pivot: 1.3666
Supporting reasons: Identified as a pullback support that aligns with the 38.2% Fibonacci retracement, where renewed buying pressure could emerge to push the price higher.
1st support: 1.3566
Supporting reasons: Identified as a pullback support that aligns with the 61.8% Fibonacci retracement, indicating a potential area where the price could stabilize once more.
1st resistance: 1.3924
Supporting reasons: Identified as a swing resistance, indicating a potential level that could halt further upward movement.
GBP/JPY:
Potential Direction: Bearish
Overall momentum of the chart: Bullish
The price could see a short-term pullback toward the pivot before continuing its bearish move down toward the 1st support.
Pivot: 211.96
Supporting reasons: Identified as a pullback resistance that aligns with the 50% Fibonacci retracement, where selling pressures could intensify and potentially cap any upward retracement.
1st support: 208.94
Supporting reasons: Identified as a pullback support, indicating a potential level where the price could stabilize once more.
1st resistance: 214.29
Supporting reasons: Identified as a swing high resistance, indicating a potential level that could halt further upward movement.
USD/CHF:
Potential Direction: Bearish
Overall momentum of the chart: Bearish
The price could see a short-term pullback toward the pivot before continuing its bearish move down toward the 1st support.
Pivot: 0.7737
Supporting reasons: Identified as a pullback resistance, where selling pressures could intensify and potentially cap any upward retracement.
1st support: 0.7589
Supporting reasons: Identified as a swing low support, indicating a potential level where the price could stabilize once again.
1st resistance: 0.7858
Supporting reasons: Identified as a pullback resistance, indicating a potential level that could cap further upward movement.
USD/JPY:
Potential Direction: Bearish
Overall momentum of the chart: Bullish
The price could see a short-term pullback toward the pivot before continuing its bearish move down toward the 1st support.
Pivot: 154.67
Supporting reasons: Identified as an overlap resistance, where selling pressures could intensify and potentially cap any upward retracement.
1st support: 151.22
Supporting reasons: Identified as a swing low support that aligns with the 161.8% Fibonacci extension, indicating a strong area where buyers might return, and the price could stabilize once again.
1st resistance: 156.21
Supporting reasons: Identified as a pullback resistance. This level represents the next key area where upward movement could be capped amid increased selling pressure
USD/CAD:
Potential Direction: Bearish
Overall momentum of the chart: Bearish
The price could see a short-term pullback toward the pivot before continuing its bearish move down toward the 1st support.
Pivot: 1.3651
Supporting reasons: Identified as a pullback resistance, where selling pressures could intensify and potentially cap any upward retracement.
1st support: 1.3464
Supporting reasons: Identified as a swing low support that aligns with the 161.8% Fibonacci extension, indicating a key level where the price could stabilize once more.
1st resistance: 1.3792
Supporting reasons: Identified as an overlap resistance, making it a possible target for bullish advances and a level where some sellers could return to cap gains
AUD/USD:
Potential Direction: Bullish
Overall momentum of the chart: Bullish
The price could see a short-term pullback toward the pivot before rising again toward the 1st resistance.
Pivot: 0.6934
Supporting reasons: Identified as a pullback support, where renewed buying pressure could emerge to push the price higher.
1st support: 0.6760
Supporting reasons: Identified as a pullback support, this area has provided strong support historically and may attract buying interest for a potential short-term bounce
1st resistance: 0.7221
Supporting reasons: Identified as a swing high resistance, indicating a potential area that could halt any further upward movement.
NZD/USD
Potential Direction: Bullish
Overall momentum of the chart: Bullish
The price could see a short-term pullback toward the pivot before rising again toward the 1st resistance.
Pivot: 0.5991
Supporting reasons: Identified as a pullback support, where renewed buying pressure could emerge to push the price higher.
1st support: 0.5913
Supporting reasons: Identified as a pullback support, this area has provided strong support historically and may attract buying interest for a potential short-term bounce
1st resistance: 0.6121
Supporting reasons: Identified as a swing high resistance, indicating a potential area that could halt any further upward movement.
US30 (DJIA):
Potential Direction: Bullish
Overall momentum of the chart: Bullish
The price could see a short-term pullback toward the pivot before rising again toward the 1st resistance.
Pivot: 48,844.50
Supporting reasons: Identified as a pullback support that aligns with the 61.8% Fibonacci retracement, where renewed buying pressure could emerge to push the price higher.
1st support: 48,330.52
Supporting reasons: Identified as an overlap support, suggesting a potential area where the price could stabilize once again.
1st resistance: 49,617.45
Supporting reasons: Identified as a multi-swing high resistance, indicating a potential area that could halt any further upward movement.
DE40 (DAX):
Potential Direction: Bullish
Overall momentum of the chart: Bullish
The price has already bounced off the pivot and may continue its bullish move toward the 1st resistance
Pivot: 24,455.54
Supporting reasons: Identified as a pullback support that aligns with the 61.8% Fibonacci retracement, where renewed buying pressure could emerge to push the price higher.
1st support: 23,870.49
Supporting reasons: Identified as an overlap support, indicating a key level where the price could stabilize once more.
1st resistance: 25,046.80
Supporting reasons: Identified as a pullback resistance that aligns with the 61.8% Fibonacci retracement, indicating a potential area that could halt any further upward movement.
US500 (S&P 500):
Potential Direction: Bullish
Overall momentum of the chart: Bullish
The price could see a short-term pullback toward the pivot before rising again toward the 1st resistance.
Pivot: 6,978.36
Supporting reasons: Identified as a pullback support, where renewed buying pressure could emerge to push the price higher.
1st support: 6,892.90
Supporting reasons: Identified as an overlap support, indicating a potential level where the price could stabilize once again.
1st resistance: 7,131.67
Supporting reasons: Identified as a resistance that aligns with the 161.8% Fibonacci extension, indicating a potential area that could halt any further upward movement.
BTC/USD (Bitcoin):
Potential Direction: Bearish
Overall momentum of the chart: Bearish
The price could see a short-term pullback toward the pivot before continuing its bearish move down toward the 1st support.
Pivot: 90,028.92
Supporting reasons: Identified as a pullback resistance, where selling pressures could intensify and potentially cap any upward retracement.
1st support: 85,662.64
Supporting reasons: Identified as a swing low support, indicating a potential level where the price could stabilize once more.
1st resistance: 92,360
Supporting reasons: Identified as a pullback resistance, indicating a potential area that could halt any further upward movement.
ETH/USD (Ethereum):
Potential Direction: Bearish
Overall momentum of the chart: Bullish
The price has already reacted off the pivot and may continue its bearish move toward the 1st support.
Pivot: 3,046.65
Supporting reasons: Identified as a pullback resistance, where selling pressures could intensify and potentially cap any upward retracement.
1st support: 2,807.741
Supporting reasons: Identified as a swing low support, indicating a potential level where the price could stabilize once more.
1st resistance: 3,203.35
Supporting reasons: Identified as a pullback resistance, indicating a potential area that could halt any further upward movement.
WTI/USD (Oil):
Potential Direction: Bullish
Overall momentum of the chart: Bullish
The price has already bounced off the pivot and may continue its bullish move toward the 1st resistance
Pivot: 62.03
Supporting reasons: Identified as a pullback support that aligns with the 50% Fibonacci retracement, where renewed buying pressure could emerge to push the price higher.
1st support: 60.26
Supporting reasons: Identified as an overlap support, indicating a key level where the price could stabilize once more.
1st resistance: 64.55
Supporting reasons: Identified as a resistance that aligns with the 161.8% Fibonacci extension, indicating a potential area that could halt any further upward movement.
XAU/USD (GOLD):
Potential Direction: Bullish
Overall momentum of the chart: Bullish
The price could see a short-term pullback toward the pivot before continuing its bullish move toward the 1st resistance
Pivot: 5,308.88
Supporting reasons: Identified as a pullback support, where renewed buying pressure could emerge to push the price higher.
1st support: 5,093.49
Supporting reasons: Identified as a pullback support, indicating a key level where the price could stabilize once more.
1st resistance: 5,637.86
Supporting reasons: Identified as a resistance that aligns with the 161.8% Fibonacci projection, indicating a potential area that could halt any further upward movement.
The accuracy, completeness and timeliness of the information contained on this site cannot be guaranteed. IC Markets Global does not warranty, guarantee or make any representations, or assume any liability regarding financial results based on the use of the information in the site.
News, views, opinions, recommendations and other information obtained from sources outside of www.icmarkets.com, used in this site are believed to be reliable, but we cannot guarantee their accuracy or completeness. All such information is subject to change at any time without notice. IC Markets Global assumes no responsibility for the content of any linked site.
The fact that such links may exist does not indicate approval or endorsement of any material contained on any linked site. IC Markets Global is not liable for any harm caused by the transmission, through accessing the services or information on this site, of a computer virus, or other computer code or programming device that might be used to access, delete, damage, disable, disrupt or otherwise impede in any manner, the operation of the site or of any user’s software, hardware, data or property.
The post Thursday 29th January 2026: Technical Outlook and Review first appeared on IC Markets | Official Blog.
Thursday 29th January 2026: Technical Outlook and Review
425914 January 29, 2026 18:00 ICMarkets Market News
DXY (U.S. Dollar Index):
Potential Direction: Bearish
Overall momentum of the chart: Bearish
The price could see a short-term pullback toward the pivot before continuing its bearish move down toward the 1st support.
Pivot: 96.57
Supporting reasons: Identified as a pullback resistance, where selling pressures could intensify and potentially cap any upward retracement.
1st support: 94.95
Supporting reasons: Identified as a support that aligns with the 361.8% Fibonacci extension, indicating a potential area where the price could again stabilize.
1st resistance: 97.74
Supporting reasons: Identified as a pullback resistance, indicating a potential area that could halt any further upward movement
EUR/USD:
Potential Direction: Bullish
Overall momentum of the chart: Bullish
The price could see a short-term pullback toward the pivot before continuing its bullish move toward the 1st resistance
Pivot: 1.1875
Supporting reasons: Identified as a pullback support, where renewed buying pressure could emerge to push the price higher.
1st support: 1.1805
Supporting reasons: Identified as a pullback support, indicating a potential level where the price could stabilize once again.
1st resistance: 1.2092
Supporting reasons: Identified as a resistance that aligns with the 161.8% Fibonacci projection, indicating a potential level that could cap further upward movement.
EUR/JPY:
Potential Direction: Bearish
Overall momentum of the chart: Bullish
The price could see a short-term pullback toward the pivot before continuing its bearish move down toward the 1st support.
Pivot: 183.52
Supporting reasons: Identified as a pullback resistance that aligns with the 38.2% Fibonacci retracement, where selling pressures could intensify and potentially cap any upward retracement.
1st support: 181.72
Supporting reasons: Identified as an overlap support, indicating a potential area where the price could again stabilize.
1st resistance: 184.82
Supporting reasons: Identified as a pullback resistance that aligned with the 61.8% Fibonacci retracement, indicating a potential level that could cap further upward movement.
EUR/GBP:
Potential Direction: Bearish
Overall momentum of the chart: Bullish
The price could see a short-term pullback toward the pivot before continuing its bearish move down toward the 1st support.
Pivot: 0.8695
Supporting reasons: Identified as an overlap resistance, where selling pressures could intensify and potentially cap any upward retracement.
1st support: 0.8643
Supporting reasons: Identified as a multi-swing low support, indicating a potential area where the price could stabilize once more.
1st resistance: 0.8745
Supporting reasons: Identified as an overlap resistance, indicating a potential level that could cap further upward movement.
GBP/USD:
Potential Direction: Bullish
Overall momentum of the chart: Bullish
The price could see a short-term pullback toward the pivot before rising again toward the 1st resistance.
Pivot: 1.3666
Supporting reasons: Identified as a pullback support that aligns with the 38.2% Fibonacci retracement, where renewed buying pressure could emerge to push the price higher.
1st support: 1.3566
Supporting reasons: Identified as a pullback support that aligns with the 61.8% Fibonacci retracement, indicating a potential area where the price could stabilize once more.
1st resistance: 1.3924
Supporting reasons: Identified as a swing resistance, indicating a potential level that could halt further upward movement.
GBP/JPY:
Potential Direction: Bearish
Overall momentum of the chart: Bullish
The price could see a short-term pullback toward the pivot before continuing its bearish move down toward the 1st support.
Pivot: 211.96
Supporting reasons: Identified as a pullback resistance that aligns with the 50% Fibonacci retracement, where selling pressures could intensify and potentially cap any upward retracement.
1st support: 208.94
Supporting reasons: Identified as a pullback support, indicating a potential level where the price could stabilize once more.
1st resistance: 214.29
Supporting reasons: Identified as a swing high resistance, indicating a potential level that could halt further upward movement.
USD/CHF:
Potential Direction: Bearish
Overall momentum of the chart: Bearish
The price could see a short-term pullback toward the pivot before continuing its bearish move down toward the 1st support.
Pivot: 0.7737
Supporting reasons: Identified as a pullback resistance, where selling pressures could intensify and potentially cap any upward retracement.
1st support: 0.7589
Supporting reasons: Identified as a swing low support, indicating a potential level where the price could stabilize once again.
1st resistance: 0.7858
Supporting reasons: Identified as a pullback resistance, indicating a potential level that could cap further upward movement.
USD/JPY:
Potential Direction: Bearish
Overall momentum of the chart: Bullish
The price could see a short-term pullback toward the pivot before continuing its bearish move down toward the 1st support.
Pivot: 154.67
Supporting reasons: Identified as an overlap resistance, where selling pressures could intensify and potentially cap any upward retracement.
1st support: 151.22
Supporting reasons: Identified as a swing low support that aligns with the 161.8% Fibonacci extension, indicating a strong area where buyers might return, and the price could stabilize once again.
1st resistance: 156.21
Supporting reasons: Identified as a pullback resistance. This level represents the next key area where upward movement could be capped amid increased selling pressure
USD/CAD:
Potential Direction: Bearish
Overall momentum of the chart: Bearish
The price could see a short-term pullback toward the pivot before continuing its bearish move down toward the 1st support.
Pivot: 1.3651
Supporting reasons: Identified as a pullback resistance, where selling pressures could intensify and potentially cap any upward retracement.
1st support: 1.3464
Supporting reasons: Identified as a swing low support that aligns with the 161.8% Fibonacci extension, indicating a key level where the price could stabilize once more.
1st resistance: 1.3792
Supporting reasons: Identified as an overlap resistance, making it a possible target for bullish advances and a level where some sellers could return to cap gains
AUD/USD:
Potential Direction: Bullish
Overall momentum of the chart: Bullish
The price could see a short-term pullback toward the pivot before rising again toward the 1st resistance.
Pivot: 0.6934
Supporting reasons: Identified as a pullback support, where renewed buying pressure could emerge to push the price higher.
1st support: 0.6760
Supporting reasons: Identified as a pullback support, this area has provided strong support historically and may attract buying interest for a potential short-term bounce
1st resistance: 0.7221
Supporting reasons: Identified as a swing high resistance, indicating a potential area that could halt any further upward movement.
NZD/USD
Potential Direction: Bullish
Overall momentum of the chart: Bullish
The price could see a short-term pullback toward the pivot before rising again toward the 1st resistance.
Pivot: 0.5991
Supporting reasons: Identified as a pullback support, where renewed buying pressure could emerge to push the price higher.
1st support: 0.5913
Supporting reasons: Identified as a pullback support, this area has provided strong support historically and may attract buying interest for a potential short-term bounce
1st resistance: 0.6121
Supporting reasons: Identified as a swing high resistance, indicating a potential area that could halt any further upward movement.
US30 (DJIA):
Potential Direction: Bullish
Overall momentum of the chart: Bullish
The price could see a short-term pullback toward the pivot before rising again toward the 1st resistance.
Pivot: 48,844.50
Supporting reasons: Identified as a pullback support that aligns with the 61.8% Fibonacci retracement, where renewed buying pressure could emerge to push the price higher.
1st support: 48,330.52
Supporting reasons: Identified as an overlap support, suggesting a potential area where the price could stabilize once again.
1st resistance: 49,617.45
Supporting reasons: Identified as a multi-swing high resistance, indicating a potential area that could halt any further upward movement.
DE40 (DAX):
Potential Direction: Bullish
Overall momentum of the chart: Bullish
The price has already bounced off the pivot and may continue its bullish move toward the 1st resistance
Pivot: 24,455.54
Supporting reasons: Identified as a pullback support that aligns with the 61.8% Fibonacci retracement, where renewed buying pressure could emerge to push the price higher.
1st support: 23,870.49
Supporting reasons: Identified as an overlap support, indicating a key level where the price could stabilize once more.
1st resistance: 25,046.80
Supporting reasons: Identified as a pullback resistance that aligns with the 61.8% Fibonacci retracement, indicating a potential area that could halt any further upward movement.
US500 (S&P 500):
Potential Direction: Bullish
Overall momentum of the chart: Bullish
The price could see a short-term pullback toward the pivot before rising again toward the 1st resistance.
Pivot: 6,978.36
Supporting reasons: Identified as a pullback support, where renewed buying pressure could emerge to push the price higher.
1st support: 6,892.90
Supporting reasons: Identified as an overlap support, indicating a potential level where the price could stabilize once again.
1st resistance: 7,131.67
Supporting reasons: Identified as a resistance that aligns with the 161.8% Fibonacci extension, indicating a potential area that could halt any further upward movement.
BTC/USD (Bitcoin):
Potential Direction: Bearish
Overall momentum of the chart: Bearish
The price could see a short-term pullback toward the pivot before continuing its bearish move down toward the 1st support.
Pivot: 90,028.92
Supporting reasons: Identified as a pullback resistance, where selling pressures could intensify and potentially cap any upward retracement.
1st support: 85,662.64
Supporting reasons: Identified as a swing low support, indicating a potential level where the price could stabilize once more.
1st resistance: 92,360
Supporting reasons: Identified as a pullback resistance, indicating a potential area that could halt any further upward movement.
ETH/USD (Ethereum):
Potential Direction: Bearish
Overall momentum of the chart: Bullish
The price has already reacted off the pivot and may continue its bearish move toward the 1st support.
Pivot: 3,046.65
Supporting reasons: Identified as a pullback resistance, where selling pressures could intensify and potentially cap any upward retracement.
1st support: 2,807.741
Supporting reasons: Identified as a swing low support, indicating a potential level where the price could stabilize once more.
1st resistance: 3,203.35
Supporting reasons: Identified as a pullback resistance, indicating a potential area that could halt any further upward movement.
WTI/USD (Oil):
Potential Direction: Bullish
Overall momentum of the chart: Bullish
The price has already bounced off the pivot and may continue its bullish move toward the 1st resistance
Pivot: 62.03
Supporting reasons: Identified as a pullback support that aligns with the 50% Fibonacci retracement, where renewed buying pressure could emerge to push the price higher.
1st support: 60.26
Supporting reasons: Identified as an overlap support, indicating a key level where the price could stabilize once more.
1st resistance: 64.55
Supporting reasons: Identified as a resistance that aligns with the 161.8% Fibonacci extension, indicating a potential area that could halt any further upward movement.
XAU/USD (GOLD):
Potential Direction: Bullish
Overall momentum of the chart: Bullish
The price could see a short-term pullback toward the pivot before continuing its bullish move toward the 1st resistance
Pivot: 5,308.88
Supporting reasons: Identified as a pullback support, where renewed buying pressure could emerge to push the price higher.
1st support: 5,093.49
Supporting reasons: Identified as a pullback support, indicating a key level where the price could stabilize once more.
1st resistance: 5,637.86
Supporting reasons: Identified as a resistance that aligns with the 161.8% Fibonacci projection, indicating a potential area that could halt any further upward movement.
The accuracy, completeness and timeliness of the information contained on this site cannot be guaranteed. IC Markets Global does not warranty, guarantee or make any representations, or assume any liability regarding financial results based on the use of the information in the site.
News, views, opinions, recommendations and other information obtained from sources outside of www.icmarkets.com, used in this site are believed to be reliable, but we cannot guarantee their accuracy or completeness. All such information is subject to change at any time without notice. IC Markets Global assumes no responsibility for the content of any linked site.
The fact that such links may exist does not indicate approval or endorsement of any material contained on any linked site. IC Markets Global is not liable for any harm caused by the transmission, through accessing the services or information on this site, of a computer virus, or other computer code or programming device that might be used to access, delete, damage, disable, disrupt or otherwise impede in any manner, the operation of the site or of any user’s software, hardware, data or property.
The post Thursday 29th January 2026: Technical Outlook and Review first appeared on IC Markets | Official Blog.
Dollar recovers some poise on the day, some light profit-taking in precious metals
425913 January 29, 2026 17:40 Forexlive Latest News Market News
The dollar started the day relatively poorly but is now bouncing back modestly in European morning trade. The greenback has pared declines across the board and is keeping near unchanged levels on the day now. EUR/USD traded to as high as 1.1996 earlier but is now back down to 1.1950 levels while AUD/USD is back down to 0.7047 after having been up as high as 0.7094 earlier in the day.
Besides that, USD/JPY is keeping back above the 153.00 mark to 153.30 with the pair having started the session near the figure level. And USD/CHF is also just off lows around 0.7650 to 0.7677 at the moment.
For the euro, the 1.2000 line is a crucial one to watch with ECB policymakers starting to step in with some verbal interjections on the currency. Meanwhile, yen-tervention risks remain heightened with Tokyo officials still waiting in the wings to step in and push back against any notable pressures on the currency. They were already not too happy about USD/JPY holding the line at the 100-day moving average on Tuesday and made sure to break that resolve shortly after. The key level is seen at 153.71 currently.
Despite the slight recovery here, the dollar is not quite out of the woods yet. As mentioned earlier today, the same drivers dragging down the dollar are still very much in play. And that will keep the dollar in a struggling spot barring a sharp correction in the precious metals space.
There is some light profit-taking there with gold backing down after a trip to test waters just above $5,600 earlier today. A second push in the early hours of Europe saw price come close again to test the big figure before some selling came about to send the precious metal down to a low of $5,473 in the past hour.
It’s the same story for silver as well with price there easing to $116.96 after a brief run to clip above the $120 mark in touching a fresh record high of $120.47 – which came at the same time as gold’s second run up in the early hours of Europe.
This article was written by Justin Low at investinglive.com.
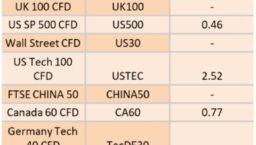
Ex-Dividend 30/01/2026
425911 January 29, 2026 17:40 ICMarkets Market News
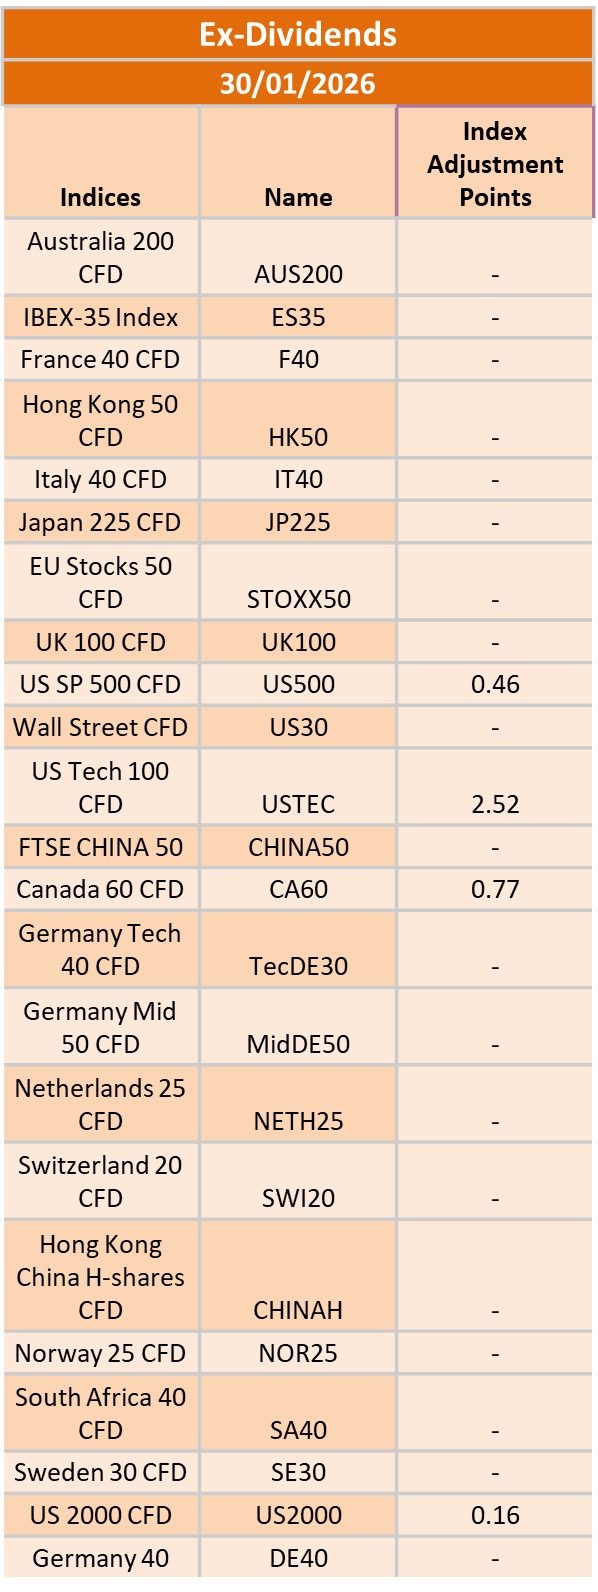
The post Ex-Dividend 30/01/2026 first appeared on IC Markets | Official Blog.