Articles

General Market Analysis – 11/11/25
423359 November 11, 2025 16:00 ICMarkets Market News
US Markets Rally After Potential Shutdown Deal – Nasdaq up 2.27%
US markets rallied strongly overnight as optimism grew that the prolonged government shutdown could finally come to an end this week after the Senate approved a key funding deal. The upbeat mood sent all three major indices sharply higher, with the Dow climbing 0.81% to close at 47,368, the S&P 500 surging 1.54% to finish at 6,832, and the tech-heavy Nasdaq leading the way with a 2.27% gain to 23,527. The dollar also moved further north, with the DXY edging up 0.07% to 99.63, while Treasury yields also firmed. The 2-year yield rose 2.7 basis points to 3.589%, and the 10-year increased by 1.9 basis points to 4.116%. Commodities were also active, with oil prices continuing to push north amid ongoing supply concerns. Brent crude added 0.64% to settle at $64.03, while WTI gained 0.59% to close at $60.10. Gold was one of the standout performers of the session, surging 2.86% to $4,115.76 as it broke out of recent consolidation ranges.
UK Data in Focus for Sterling Traders This Week
Sterling traders are expecting another busy week with some key data due out that could move Bank of England rate expectations significantly. Key concerns for the MPC, which had increased chances of a rate cut last week, have been both the jobs market and economic growth, and we have data from both in the days ahead this week. Tonight, we see key jobs data hitting the market, with expectations that the Claimant Count and Unemployment Rate will both tick up again, while later in the week GDP data is expected to fall on both a monthly and quarterly basis. The market is now pricing in a 75% chance of a 25-basis point rate cut in December, and significant prints away from expectations in the data this week could see big moves in both Cable and sterling crosses.
Busy Day Ahead for Traders
It’s shaping up to be a busier day today, with traders bracing for increased volatility following yesterday’s strong market moves and some key risk events also scheduled. The Asian market will open on the front foot after those strong moves on Wall Street last night; however, the focus will move to New Zealand midway through the day with key Inflation Expectations data (last 2.28%) due out. UK markets will be in focus shortly after the London open with key employment numbers due — the Claimant Count (exp. +17.6K), Average Earnings Index (exp. 5.0%), and Unemployment Rate (exp. 4.9%) are all released at the same time, and traders are expecting plenty of moves in the pound around the event. Liquidity could tighten later in the day, however, with both US and Canadian markets closed for holidays, which could see some moves exacerbated, especially after yesterday’s volatility.
The post General Market Analysis – 11/11/25 first appeared on IC Markets | Official Blog.
Tuesday 11th November 2025: Technical Outlook and Review
423341 November 11, 2025 15:39 ICMarkets Market News
DXY (U.S. Dollar Index):
Potential Direction: Bullish
Overall momentum of the chart: Bearish
The price could fall toward the pivot and could make a short-term pullback toward this level before rising again toward the 1st resistance.
Pivot: 99.13
Supporting reasons: Identified as a pullback support that aligns with the 50% Fibonacci retracement, where renewed buying pressure could emerge to push the price higher.
1st support: 99.13
Supporting reasons: Identified as a pullback support, indicating a potential area where the price could again stabilize.
1st resistance: 100.29
Supporting reasons: Identified as a swing high resistance, indicating a potential area that could halt any further upward movement
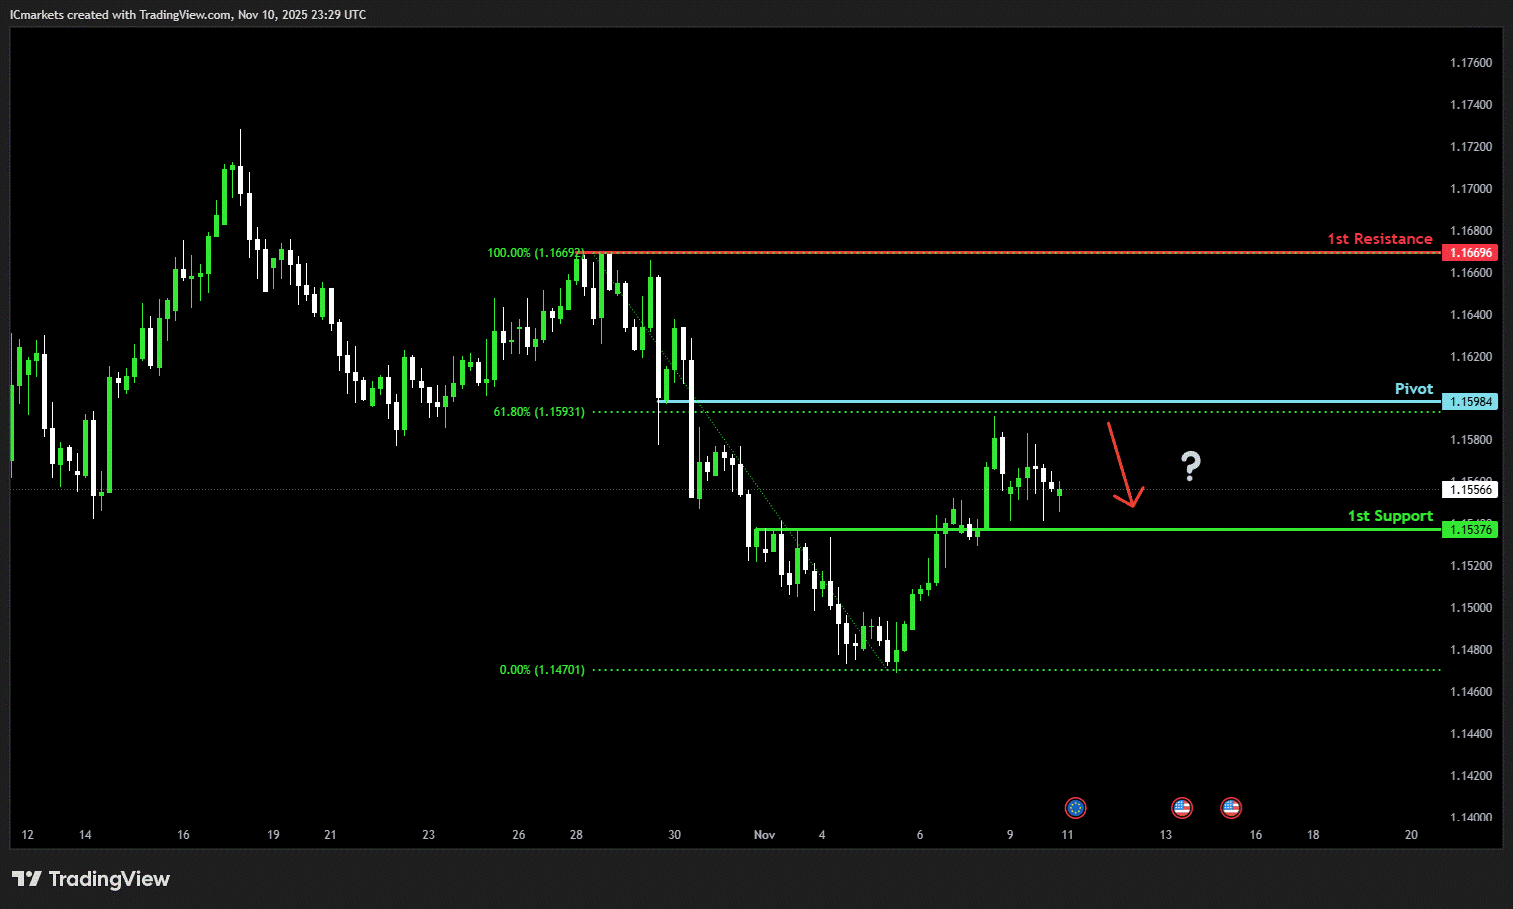
EUR/USD:
Potential Direction: Bearish
Overall momentum of the chart: Bearish
The price could see a short-term pullback toward the pivot before continuing its bearish move down toward the 1st support.
Pivot: 1.1598
Supporting reasons: Identified as an overlap resistance that aligns with the 61.8% Fibonacci retracement, where selling pressures could intensify and potentially cap any upward retracement
1st support: 1.1537
Supporting reasons: Identified as an overlap support, indicating a potential level where the price could stabilize once again.
1st resistance: 1.1669
Supporting reasons: Identified as a swing high resistance, indicating a potential level that could cap further upward movement.
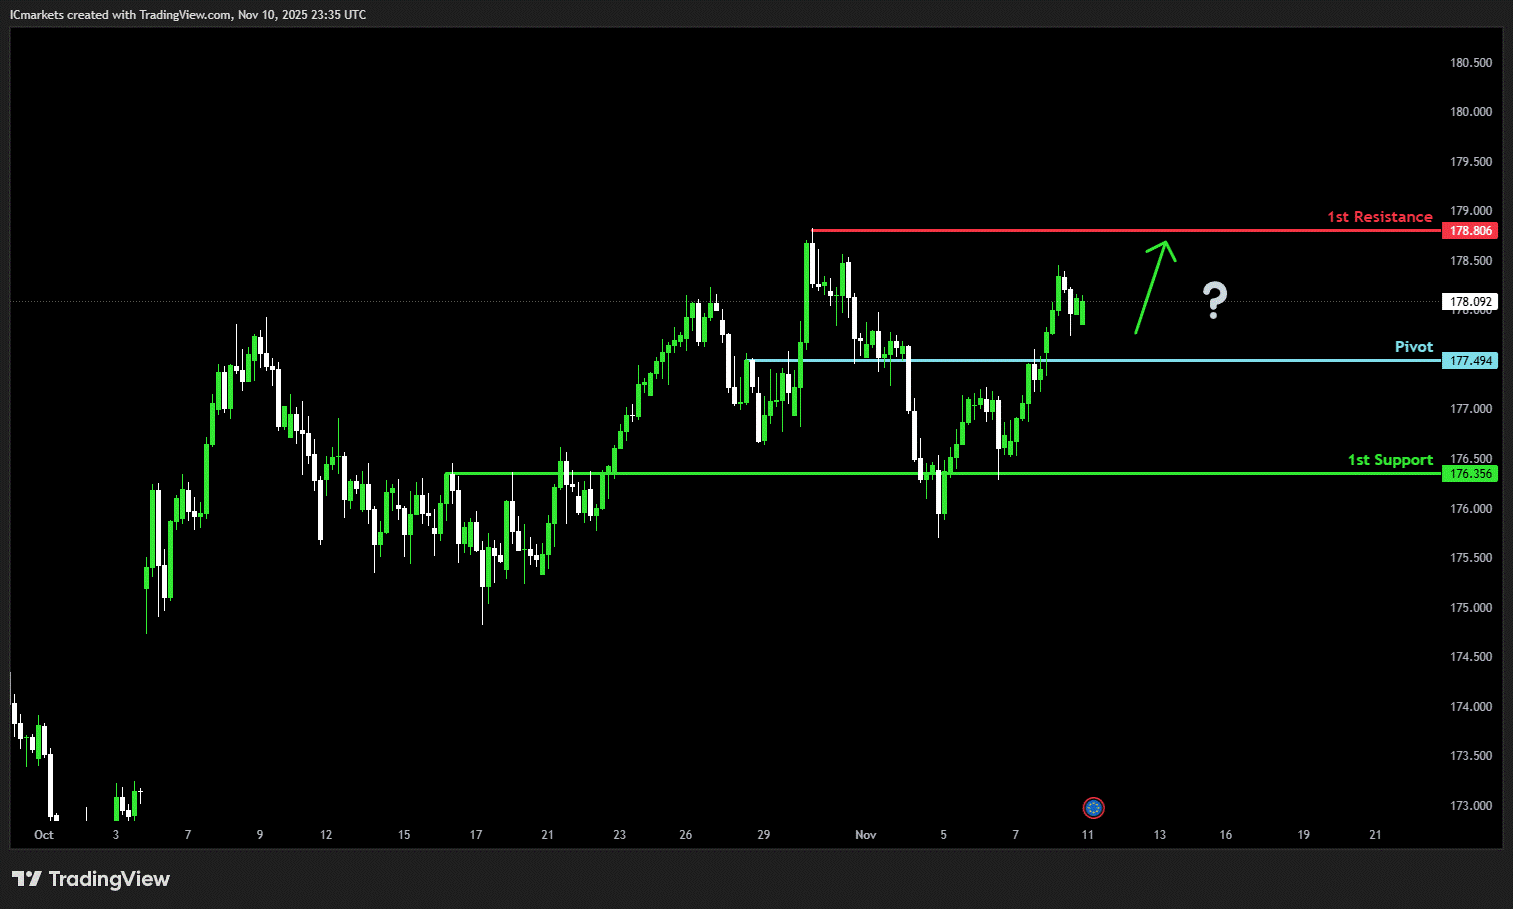
EUR/JPY:
Potential Direction: Bullish
Overall momentum of the chart: Bullish
The price could see a short-term pullback toward the pivot before rising again toward the 1st resistance.
Pivot: 177.49
Supporting reasons: Identified as a pullback support, where renewed buying pressure could emerge to push the price higher.
1st support: 176.35
Supporting reasons: Identified as an overlap support, indicating a potential area where the price could again stabilize.
1st resistance: 178.80
Supporting reasons: Identified as a swing high resistance, indicating a potential level that could cap further upward movement.
EUR/GBP:
Potential Direction: Bullish
Overall momentum of the chart: Bullish
The price could see a short-term pullback toward the pivot before rising again toward the 1st resistance.
Pivot: 0.8749
Supporting reasons: Identified as a pullback support, where renewed buying pressure could emerge to push the price higher.
1st support: 0.8718
Supporting reasons: Identified as overlap support, indicating a potential area where the price could stabilize once more.
1st resistance: 0.8825
Supporting reasons: Identified as a swing high resistance, indicating a potential level that could cap further upward movement.

GBP/USD:
Potential Direction: Bearish
Overall momentum of the chart: Bullish
The price could see a short-term pullback toward the pivot before continuing its bearish move down toward the 1st support.
Pivot: 1.3257
Supporting reasons: Identified as a pullback resistance that aligns with the 50% Fibonacci retracement, where selling pressures could intensify and potentially cap any upward retracement.
1st support: 1.3102
Supporting reasons: Identified as an overlap support, indicating a potential area where the price could stabilize once more.
1st resistance: 1.3409
Supporting reasons: Identified as a pullback resistance, indicating a potential level that could halt further upward movement.

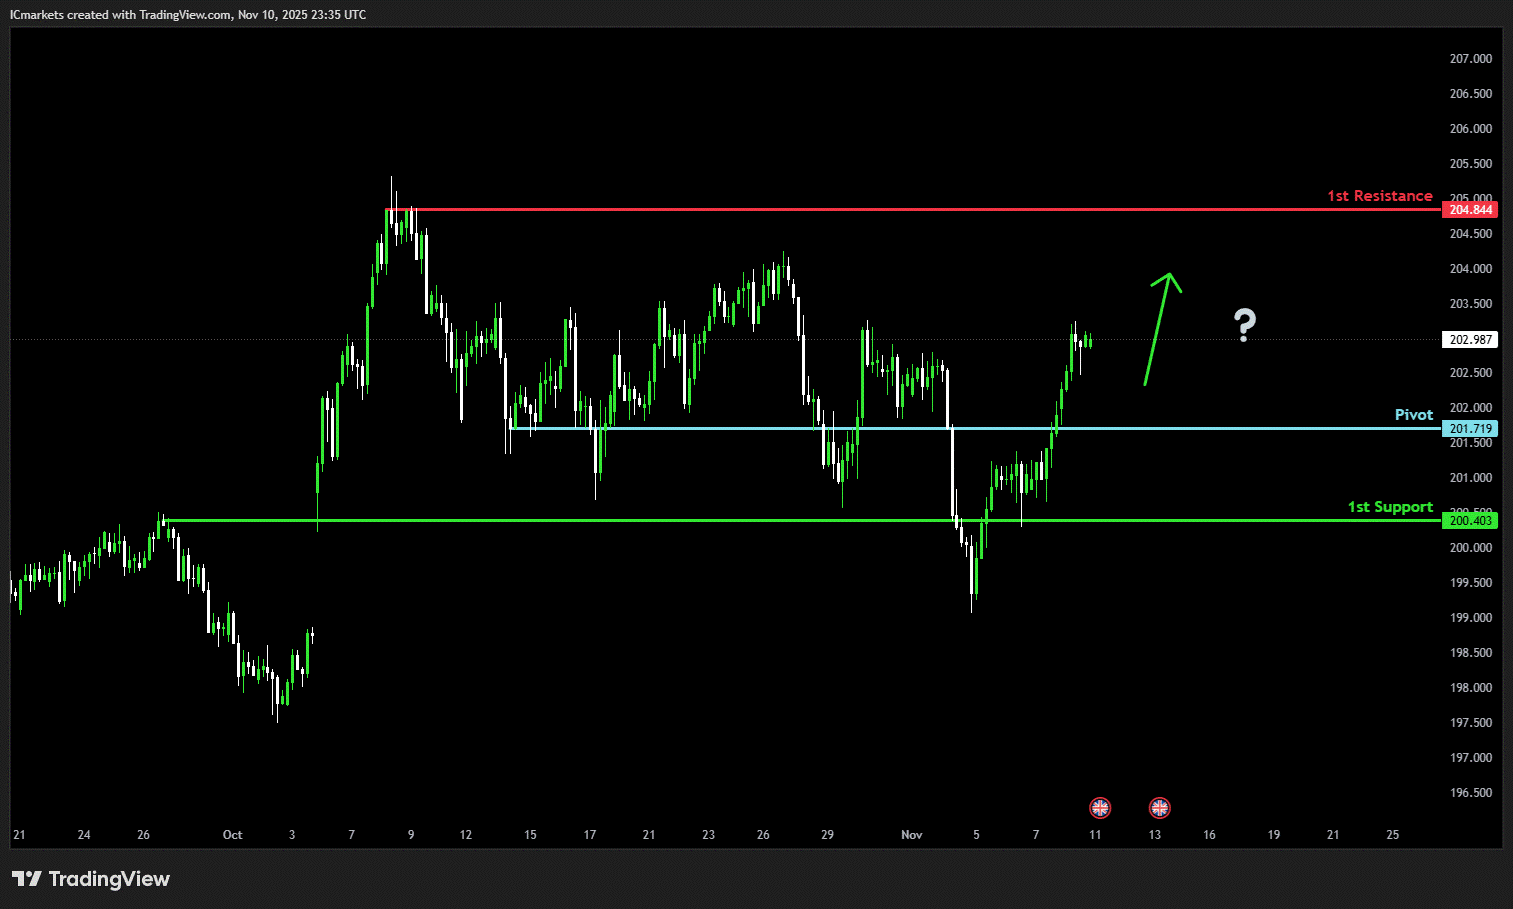
GBP/JPY:
Potential Direction: Bullish
Overall momentum of the chart: Bullish
The price could see a short-term pullback toward the pivot before rising again toward the 1st resistance.
Pivot:201.71
Supporting reasons: Identified as a pullback support, where renewed buying pressure could emerge to push the price higher.
1st support: 200.40
Supporting reasons: Identified as an overlap support, indicating a potential level where the price could stabilize once more.
1st resistance: 204.84
Supporting reasons: Identified as a swing high resistance, indicating a potential level that could halt further upward movement.
USD/CHF:
Potential Direction: Bearish
Overall momentum of the chart: Bearish
The price could see a short-term pullback toward the pivot before continuing its bearish move down toward the 1st support.
Pivot: 0.8076
Supporting reasons: Identified as a pullback resistance, where selling pressures could intensify and potentially cap any upward retracement.
1st support: 0.8009
Supporting reasons: Identified as a pullback support that aligns with the 61.8% Fibonacci retracement, indicating a potential level where the price could stabilize once again.
1st resistance: 0.8127
Supporting reasons: Identified as a swing high resistance, indicating a potential level that could cap further upward movement.

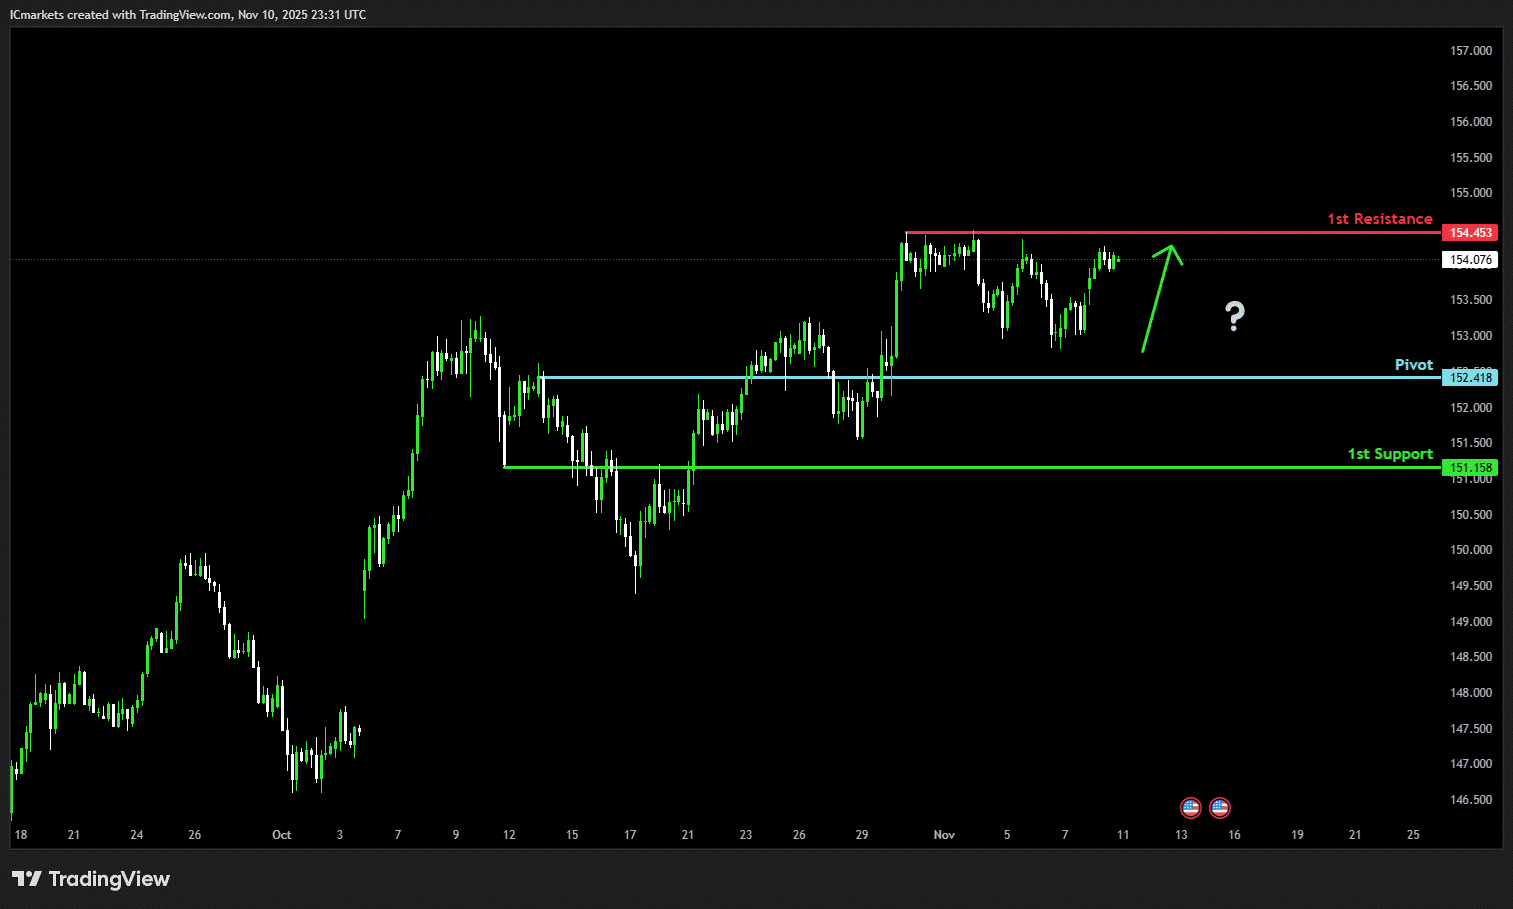
USD/JPY:
Potential Direction: Bullish
Overall momentum of the chart: Bullish
The price could see a short-term pullback toward the pivot before rising again toward the 1st resistance.
Pivot: 152.41
Supporting reasons: Identified as a pullback support, where renewed buying pressure could emerge to push the price higher.
1st support: 151.15
Supporting reasons: Identified as a pullback support, indicating a strong area where buyers might return, and the price could stabilize once again.
1st resistance: 154.45
Supporting reasons: Identified as a swing high resistance. This level represents the next key area where upward movement could be capped amid increased selling pressure
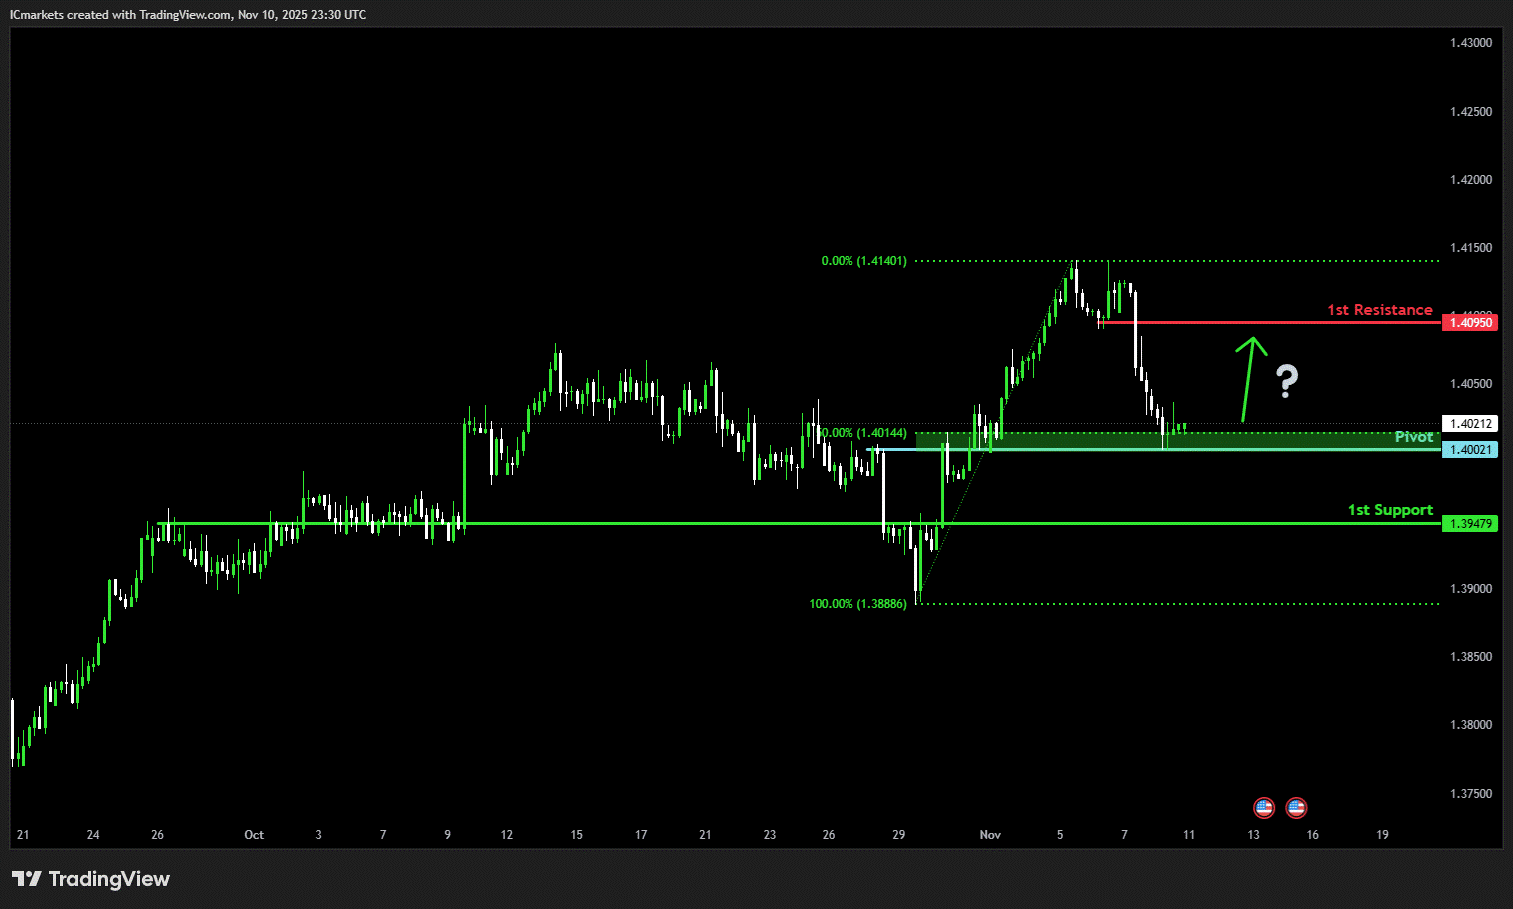
USD/CAD:
Potential Direction: Bullish
Overall momentum of the chart: Bearish
The price could see a short-term pullback toward the pivot before rising again toward the 1st resistance.
Pivot: 1.4002
Supporting reasons: Identified as an overlap that aligns with the 50% Fibonacci retracement, where renewed buying pressure could emerge to push the price higher.
1st support: 1.3947
Supporting reasons: Identified as a pullback support, indicating a key level where the price could stabilize once more.
1st resistance: 1.4095
Supporting reasons: Identified as a pullback resistance, making it a possible target for bullish advances and a level where some sellers could return to cap gains
AUD/USD:
Potential Direction: Bullish
Overall momentum of the chart: Bullish
The price has already bounced off the pivot and may continue its bullish move toward the 1st resistance
Pivot: 0.6515
Supporting reasons: Identified as a pullback support, where renewed buying pressure could emerge to push the price higher.
1st support: 0.6447
Supporting reasons: Identified as a swing low support, this area has provided strong support historically and may attract buying interest for a potential short-term bounce
1st resistance: 0.6621
Supporting reasons: Identified as an overlap resistance, indicating a potential area that could halt any further upward movement.

NZD/USD
Potential Direction: Bearish
Overall momentum of the chart: Bullish
The price could see a short-term pullback toward the pivot before continuing its bearish move down toward the 1st support.
Pivot: 0.5689
Supporting reasons: Identified as a pullback resistance, where selling pressures could intensify and potentially cap any upward retracement.
1st support: 0.5614
Supporting reasons: Identified as a support that is supported by the 161.8% Fibonacci extension, this area has provided strong support historically and may attract buying interest for a potential short-term bounce
1st resistance: 0.5760
Supporting reasons: Identified as a pullback resistance, indicating a potential area that could halt any further upward movement.

US30 (DJIA):
Potential Direction: Bearish
Overall momentum of the chart: Bullish
The price could see a short-term pullback toward the pivot before continuing its bearish move down toward the 1st support.
Pivot: 47,416.67
Supporting reasons: Identified as an overlap resistance, where selling pressures could intensify and potentially cap any upward retracement.
1st support: 46,601.64
Supporting reasons: Identified as an overlap support that aligns with the 50% Fibonacci retracement, suggesting a potential area where the price could stabilize once again.
1st resistance: 48,048.01
Supporting reasons: Identified as a swing high resistance, indicating a potential area that could halt any further upward movement.

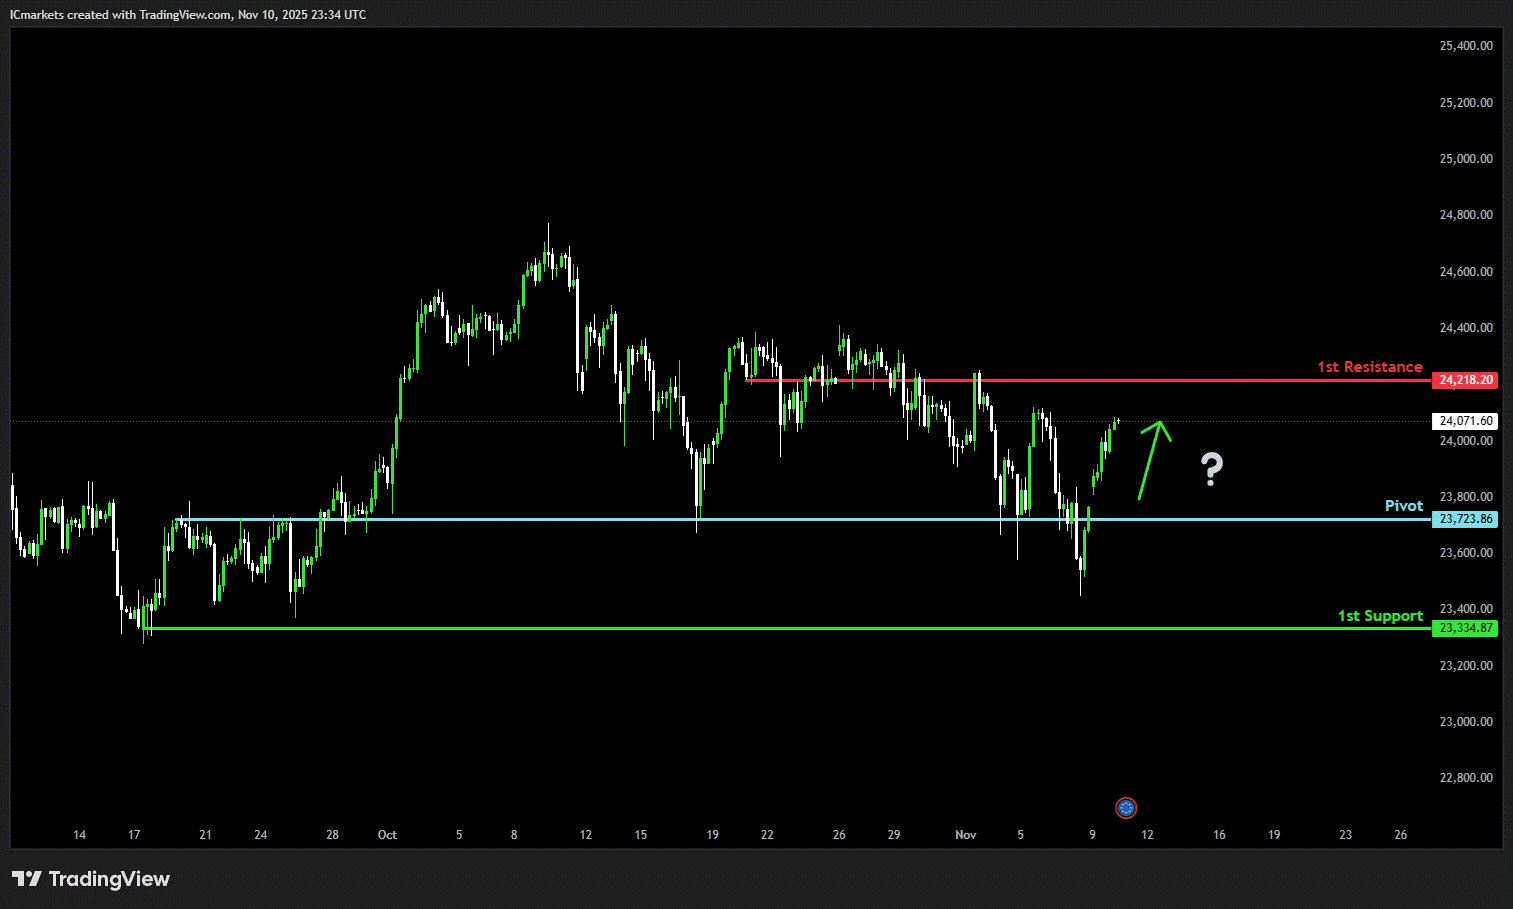
DE40 (DAX):
Potential Direction: Bullish
Overall momentum of the chart: Bullish
The price could fall toward the pivot and could make a short-term pullback toward this level before rising again toward the 1st resistance.
Pivot: 23,723.86
Supporting reasons: Identified as a pullback support that aligns with the 50% Fibonacci retracement, where renewed buying pressure could emerge to push the price higher.
1st support: 23,334.87
Supporting reasons: Identified as a swing low support, indicating a key level where the price could stabilize once more.
1st resistance: 24,218.20
Supporting reasons: Identified as an overlap resistance, indicating a potential area that could halt any further upward movement.
US500 (S&P 500):
Potential Direction: Bearish
Overall momentum of the chart: Bullish
The price has already reacted off the pivot and may continue its bearish move toward the 1st support
Pivot: 6,834.95
Supporting reasons: Identified as a pullback resistance that aligns with the 50% Fibonacci retracement, where selling pressures could intensify and potentially cap any upward retracement
1st support: 6,696.60
Supporting reasons: Identified as a pullback support, indicating a potential level where the price could stabilize once again.
1st resistance: 6.919.84
Supporting reasons: Identified as a swing high resistance, indicating a potential area that could halt any further upward movement.

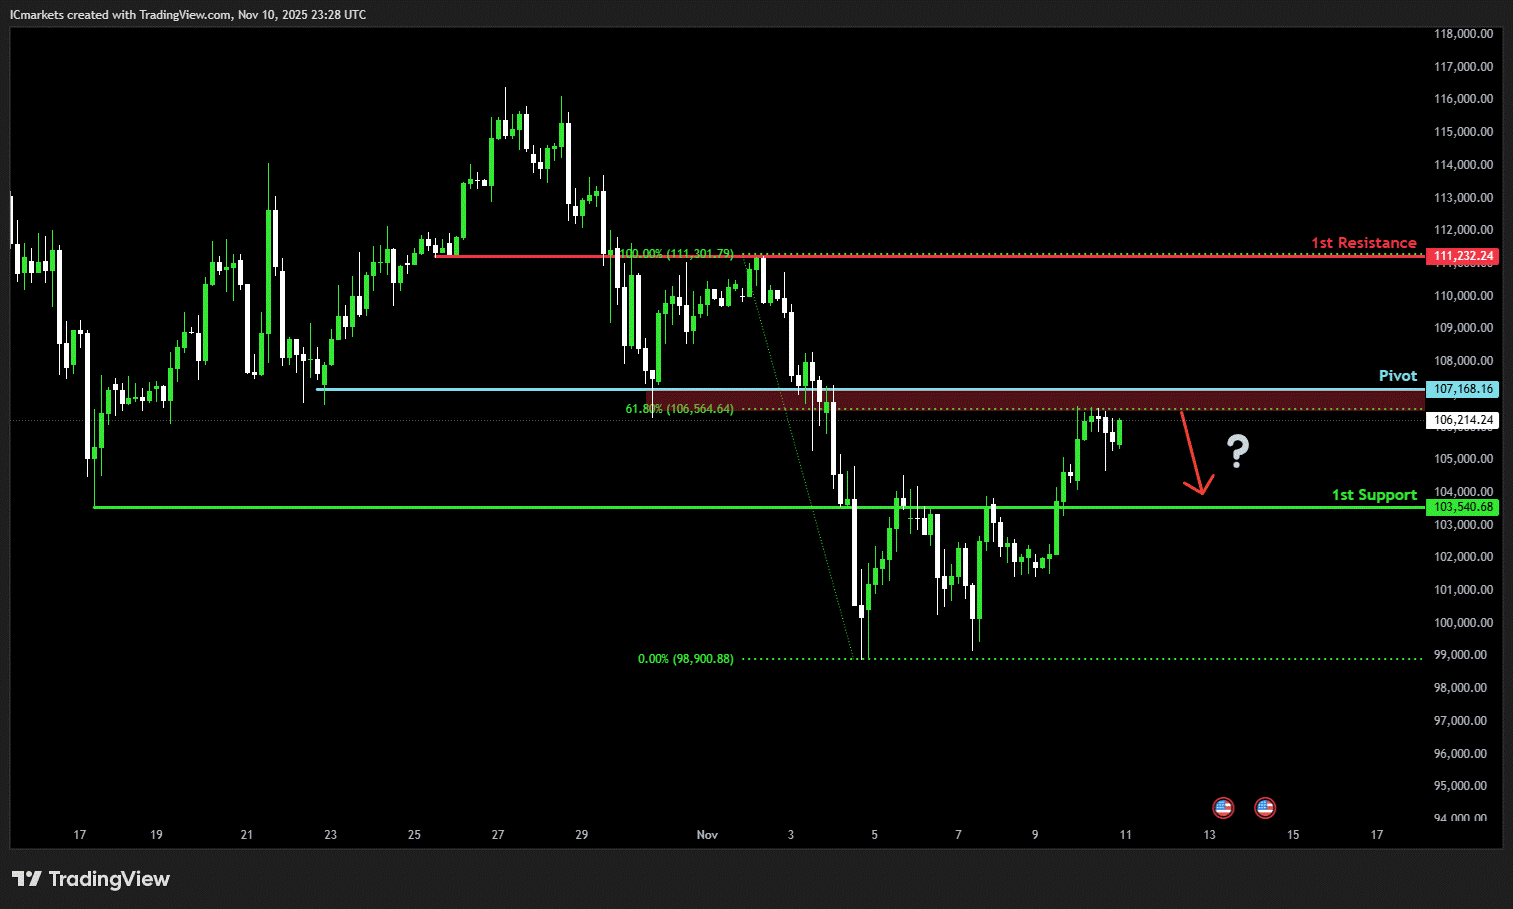
BTC/USD (Bitcoin):
Potential Direction: Bearish
Overall momentum of the chart: Bullish
The price has already reacted off the pivot and may continue its bearish move toward the 1st support
Pivot: 107,168.16
Supporting reasons: Identified as a pullback resistance that aligns with the 61.8% Fibonacci retracement, where selling pressures could intensify and potentially cap any upward retracement
1st support: 103,540
Supporting reasons: Identified as an overlap support that aligns closely with the 161.8% Fibonacci extension, indicating a potential level where the price could stabilize once more.
1st resistance: 111,232.24
Supporting reasons: Identified as an overlap resistance, indicating a potential area that could halt any further upward movement.
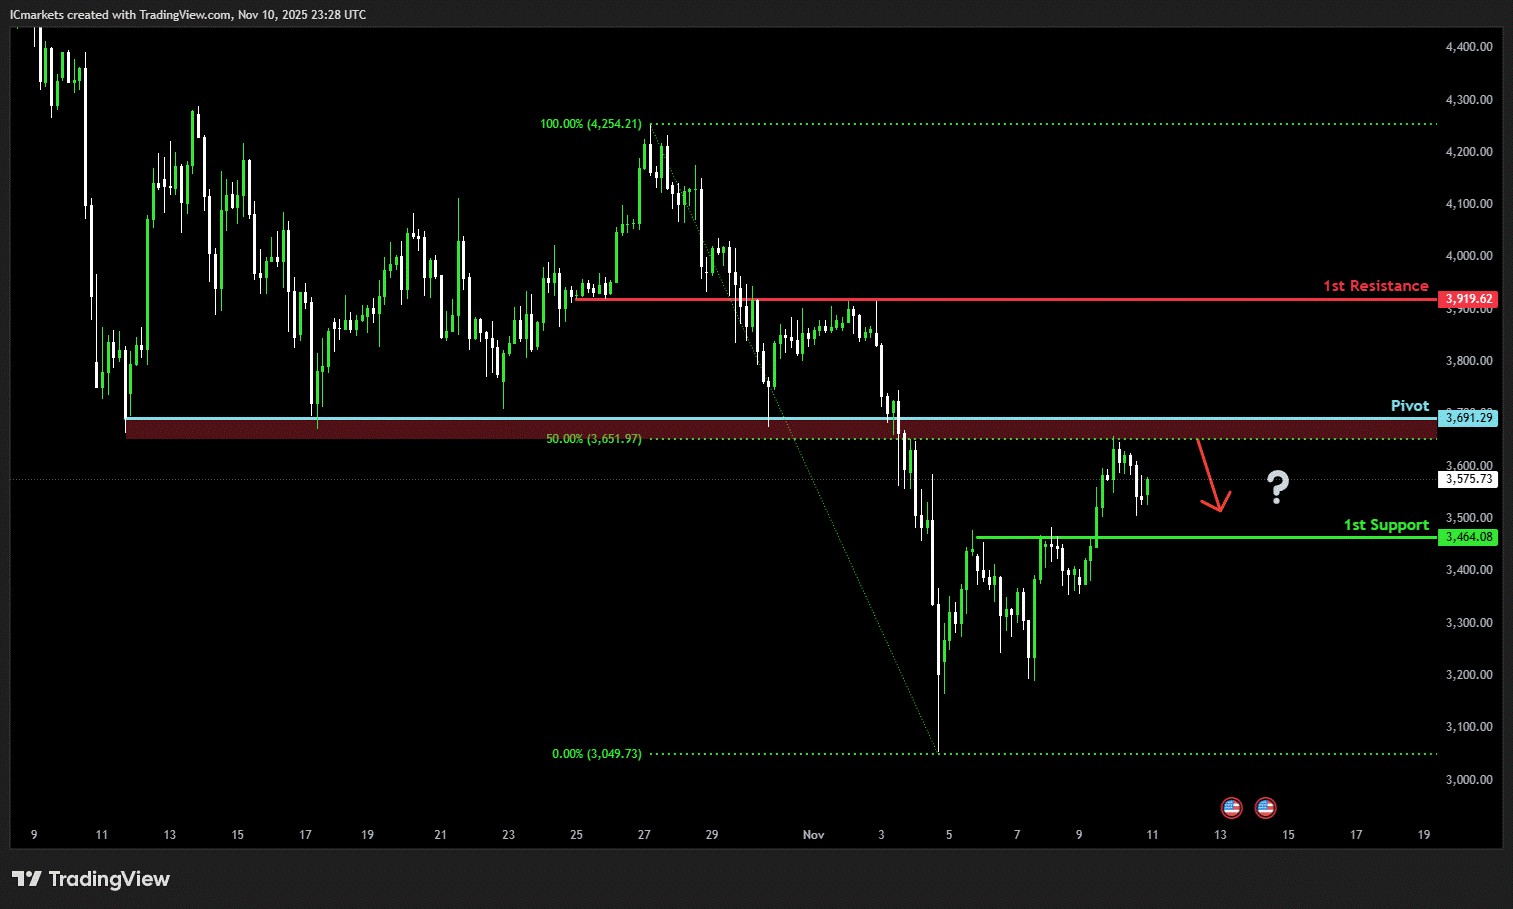
ETH/USD (Ethereum):
Potential Direction: Bearish
Overall momentum of the chart: Bullish
The price has already reacted off the pivot and may continue its bearish move toward the 1st support
Pivot: 3,691.29
Supporting reasons: Identified as an overlap resistance that aligns with the 50% Fibonacci retracement, where selling pressures could intensify and potentially cap any upward retracement
1st support: 3,464.08
Supporting reasons: Identified as a pullback support, indicating a potential level where the price could stabilize once more.
1st resistance: 3,919.62
Supporting reasons: Identified as an overlap resistance, indicating a potential area that could halt any further upward movement.
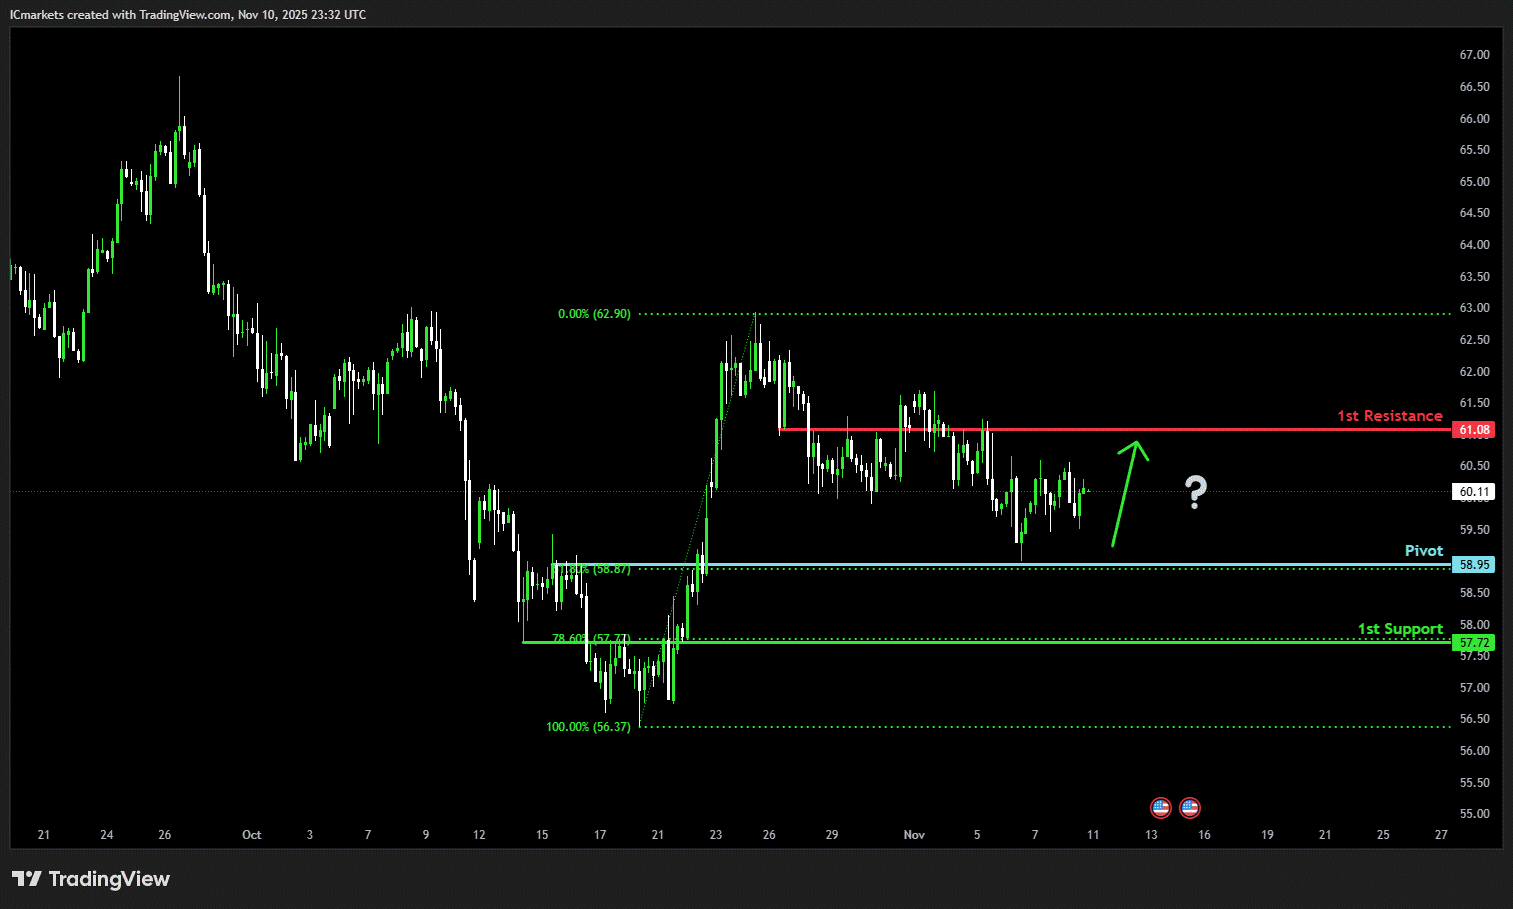
WTI/USD (Oil):
Potential Direction: Bullish
Overall momentum of the chart: Bullish
The price has already bounced off the pivot and may continue its bullish move toward the 1st resistance
Pivot: 58.95
Supporting reasons: Identified as a pullback support that aligns with the 61.8% Fibonacci retracement, where renewed buying pressure could emerge to push the price higher.
1st support: 57.72
Supporting reasons: Identified as a pullback support that aligns with the 78.6% Fibonacci retracement, indicating a key level where the price could stabilize once more.
1st resistance: 61.08
Supporting reasons: Identified as an overlap resistance, indicating a potential area that could halt any further upward movement.
XAU/USD (GOLD):
Potential Direction: Bullish
Overall momentum of the chart: Bullish
The price could fall toward the pivot and could make a short-term pullback toward this level before rising again toward the 1st resistance.
Pivot: 4,055.75
Supporting reasons: Identified as a pullback support, where renewed buying pressure could emerge to push the price higher.
1st support: 3,891.10
Supporting reasons: Identified as an overlap support that aligns closely with the 78.6% Fibonacci projection, indicating a key level where the price could stabilize once more.
1st resistance: 4,152.39
Supporting reasons: Identified as a pullback resistance that aligns closely with the 50% FIbonacci retracememnt and the the 127.2% Fibonacci projection , indicating a potential area that could halt any further upward movement.

The accuracy, completeness and timeliness of the information contained on this site cannot be guaranteed. IC Markets does not warranty, guarantee or make any representations, or assume any liability regarding financial results based on the use of the information in the site.
News, views, opinions, recommendations and other information obtained from sources outside of www.icmarkets.com, used in this site are believed to be reliable, but we cannot guarantee their accuracy or completeness. All such information is subject to change at any time without notice. IC Markets assumes no responsibility for the content of any linked site.
The fact that such links may exist does not indicate approval or endorsement of any material contained on any linked site. IC Markets is not liable for any harm caused by the transmission, through accessing the services or information on this site, of a computer virus, or other computer code or programming device that might be used to access, delete, damage, disable, disrupt or otherwise impede in any manner, the operation of the site or of any user’s software, hardware, data or property.
The post Tuesday 11th November 2025: Technical Outlook and Review first appeared on IC Markets | Official Blog.
IC Markets – Asia Fundamental Forecast | 11 November 2025
423340 November 11, 2025 15:39 ICMarkets Market News
IC Markets – Asia Fundamental Forecast | 11 November 2025
What happened in the U.S. session?
Overnight, U.S. financial markets were driven by optimism around ending the government shutdown, resulting in rallies in equities and metals, a weaker U.S. dollar, and volatile movements in digital assets. Most recent macroeconomic indicators were consistent with moderate inflation, while some scheduled releases remained delayed due to the shutdown.
What does it mean for the Asia Session?
The inflation expectations release could influence the Reserve Bank of New Zealand’s rate outlook. Higher-than-previous inflation expectations may boost NZD sentiment.UK labor indicators (the claimant count and earnings) are crucial for gauging consumer health and the BOE’s policy bias. Both appear stable/improved this month. Be prepared for increased volatility around the release times, especially if figures deviate sharply from consensus
The Dollar Index (DXY)
Key news events today
No major news event
What can we expect from DXY today?
The US Dollar is showing signs of resilience amid cautious optimism about US economic data, global central bank policies, and hopes that a US government shutdown may soon end. The dollar index (DXY) has snapped a brief losing streak and remains supported by firm economic performance, persistent inflation, and expectations that the Federal Reserve will be slow to lower interest rates further this year.
Central Bank Notes:
- The Federal Open Market Committee (FOMC) voted, by majority, to lower the federal funds rate target range by 25 basis points to 3.75%–4.00% at its October 28–29, 2025, meeting, marking the second consecutive cut following the 25 basis points reduction in September.
- The Committee maintained its long-term objectives of maximum employment and 2% inflation, noting that the labor market continues to soften, with modest job creation and an unemployment rate edging higher. In comparison, inflation remains above target at around 3.0%.
- Policymakers highlighted ongoing downside risks to economic growth, tempered by signs of resilient economic activity. September’s consumer price index (CPI) came in slightly lower than expected at 3.0% year-over-year, easing inflation pressure but still warranting vigilance given tariff-driven price effects.
- Economic activity expanded modestly in the third quarter, with GDP growth estimates around 1.0% annualized; however, uncertainty remains elevated amid persistent global trade tensions and the U.S. government shutdown, which is impacting data availability.
- The updated Summary of Economic Projections reflects an anticipated unemployment rate averaging approximately 4.5% for 2025, with headline and core personal consumption expenditures (PCE) inflation projections holding near 3.0%, indicating a slow easing path ahead.
- The Committee emphasized its flexible, data-dependent approach and underscored that future policy adjustments will be guided by incoming labor market and inflation data. As in prior meetings, there was dissent, including one member advocating a more aggressive 50-basis-point cut.
- The FOMC announced the planned conclusion of its balance sheet reduction (quantitative tightening) program, intending to cease runoff in the near term to maintain market stability, with Treasury redemption caps held steady at $5 billion per month and agency mortgage-backed securities caps at $35 billion.
- The next meeting is scheduled for 9 to 10 December 2025.
Next 24 Hours Bias
Weak Bearish
Gold (XAU)
Key news events today
No major news event
What can we expect from Gold today?
Gold prices surged on Tuesday, November 11, 2025, reaching multi-week highs driven by weak US economic data and heightened expectations of a Federal Reserve rate cut next month. Currently, gold is trading around $4,096 per troy ounce. The gold market is expected to remain volatile in the coming weeks, with estimates suggesting prices may rise modestly through November due to ongoing geopolitical and economic concerns.
Next 24 Hours Bias
Weak Bullish
The Australian Dollar (AUD)
Key news events today
No major news event
What can we expect from AUD today?
The Australian Dollar (AUD) has shown volatility, largely influenced by global risk sentiment, recent statements from the Reserve Bank of Australia (RBA), and movements in commodity markets. The AUD/USD exchange rate recently climbed above 0.65, reaching a one-week high after hawkish comments from RBA Deputy Governor Andrew Hauser, who stressed the necessity of holding monetary policy tight to contain inflation. Over the past month, the Australian Dollar has strengthened by 0.26%, though it is still down by 0.71% over the last year.
Central Bank Notes:
- The Reserve Bank of Australia held its cash rate steady at 3.60% at the November policy meeting, citing persistent inflationary pressures and lingering uncertainties in both domestic and global outlooks. This is the third consecutive pause following the cut in August.
- Policymakers remain alert to renewed inflation momentum. After a temporary uptick in September’s CPI, trimmed mean inflation for Q3 stands at 3.0%, above the intended 2–3% band. The RBA now anticipates that core inflation will stay above target until at least mid-2026, delaying any hopes of further easing.
- Headline CPI climbed by 3.2% in the year to September 2025, driven by resilient housing (+2.5%) and insurance costs, while discretionary goods inflation is subdued. The transition to monthly CPI reporting from November will improve the accuracy of inflation tracking.
- Domestic demand remains firm, particularly in services and housing, while manufacturing and discretionary retail continue to lag. Household incomes have stabilized, but high borrowing costs and elevated rents are constraining consumption and risking a slowdown in Q1 2026.
- Labor market tightness persists, though job growth has moderated. Underutilization edged higher. Wage growth is plateauing, but weak productivity is keeping unit labor costs elevated—a medium-term risk that remains central to the Board’s narrative.
- The RBA highlights geopolitical tensions and volatile commodity markets as primary global risks, against a backdrop of modest upward revisions to world growth forecasts. The Board stresses that its stance remains “cautious and data-dependent,” with ongoing vigilance on inflation, labor, and spending trends.
- Monetary policy remains mildly restrictive, balancing progress on price stability against vulnerabilities in household demand and global outlook. Board communications reaffirm a dual mandate: price stability and full employment, while underscoring readiness to respond should risks materialize sharply.
- Analysts generally expect the cash rate to remain at current levels through early 2026, with only modest cuts possible later in the year if inflation moderates. The new monthly CPI release (first full edition Nov 2025) will be watched closely for timely signals on price trends.
- The next meeting is on 9 December 2025.
Next 24 Hours Bias
Weak Bearish
The Kiwi Dollar (NZD)
Key news events today
Inflation expectations q/q (2:00 am GMT)
What can we expect from NZD today?
The New Zealand Dollar remains under pressure, and traders are closely watching for major economic releases and signs of a bottom near $0.5500 in the days ahead. The general consensus among analysts is that any sustainable recovery for NZD will be dependent on stabilization in global risk sentiment and tangible improvements in the New Zealand economy.If NZD/USD breaks below the historical support area near 0.5500, it could signal a dramatic downturn and possibly prompt new rounds of policy measures from the Reserve Bank of New Zealand.
Central Bank Notes:
- The Monetary Policy Committee (MPC) agreed to cut the Official Cash Rate (OCR) by 50 basis points to 2.50% on 8 October 2025, exceeding market expectations for a smaller 25-basis-point reduction and signaling a stronger commitment to reviving growth.
- The decision was reached by consensus, marking a shift from previous split votes, and reflected policymakers’ shared view that sustained economic weakness and persistent disinflationary pressures required a more front-loaded policy response.
- Annual consumer price inflation stood at 2.7% in the June quarter and is seen nearing 3% for the September quarter—above the 2% midpoint but within the 1–3% target range. Despite high near-term readings, the MPC projects inflation will return toward 2% by the first half of 2026 as spare capacity and moderating tradables curb price momentum.
- Policymakers acknowledged that domestic demand remains weak, with household spending, business investment, and construction activity under pressure. While still elevated, services inflation is expected to ease gradually as wage growth slows and unemployment edges higher.
- Financial conditions have eased with expectations as wholesale and retail borrowing rates adjust to lower policy settings. Bank lending data indicate a modest uptick in mortgage approvals, though broader credit demand remains subdued.
- GDP growth stalled in the middle of 2025, with high-frequency indicators showing continued weakness into the third quarter. A combination of elevated costs for essentials and falling savings continues to restrain household consumption, while global trade frictions weigh on business sentiment.
- The MPC noted that global uncertainty—particularly from US trade regulation changes and soft Chinese demand—continues to pose downside risks to export sectors, though these are partly offset by a weaker New Zealand dollar improving competitiveness.
- Subject to data confirming a sustained soft patch in activity and moderating inflation pressures, the MPC signaled further scope to reduce the OCR toward 2.25% at its next meeting on 26 November 2025, consistent with current market and Westpac forecasts.
- The next meeting is on 26 November 2025.
Next 24 Hours Bias
Medium Bearish
The Japanese Yen (JPY)
Key news events today
No major news events
What can we expect from JPY today?
As of Thursday, the Japanese yen faces multiple crosscurrents. The Bank of Japan is signaling an increasingly likely rate hike in December or January, with board members seeing normalization conditions nearly met, contingent on sustained wage growth. Inflation remains stubbornly above the 2% target at 2.9%, driven by food prices and energy costs. However, the yen’s appreciation potential is constrained by Prime Minister Takaichi’s aggressive fiscal stimulus plans and explicit calls for accommodative monetary policy.
Central Bank Notes:
- The Policy Board of the Bank of Japan met on 30–31 October and, by a clear majority vote, decided to maintain its key monetary policy approach for the upcoming period.
- The BOJ will continue to encourage the uncollateralized overnight call rate to remain at around 0.5%, in line with the prior stance.
- The gradual quarterly reduction in monthly outright purchases of Japanese Government Bonds (JGBs) remains intact, with amounts unchanged from the previous schedule. Purchases are set to decrease by about ¥400 billion per quarter through March 2026, shifting to about ¥200 billion per quarter from April to June 2026, and targeting a ¥2 trillion purchase level for Q1 2027. The bank reaffirmed its intention to maintain flexibility, with readiness to respond if market conditions warrant an adjustment.
- Japan’s economy continues to show moderate recovery, primarily led by solid capital expenditures, although export growth and corporate activity remain restrained by external demand uncertainty and the ongoing effects of U.S. trade policies.
- Annual headline inflation (excluding fresh food) accelerated to 2.9% year-on-year in September, marking the first uptick in four months and staying above the BOJ’s 2% target. Broad-based inflation persists, with food and energy cost pressures, but wage growth continues to support household consumption. Input cost pressures from the earlier surge in imports eased slightly.
- Short-term inflation momentum could moderate as food-price hikes ease, though rent, healthcare, and service-sector price increases tied to labor shortages provide support. Firms and households maintain a gradual upward drift in inflation expectations.
- For the near term, BOJ projects growth below trend as external demand stays subdued and corporate investment plans remain cautious. Still, accommodative financial conditions and steady gains in real labor income will underpin domestic consumption.
- Over the medium term, as overseas economies recover and trade conditions normalize, Japan’s growth potential should improve. Persistent labor market tightness, higher wage settlements, and rising medium- to long-term inflation expectations are expected to keep core inflation on a gradual upward trajectory, converging toward the 2% price stability target later in the forecast horizon.
- The next meeting is scheduled for 18 to 19 December 2025.
Next 24 Hours Bias
Weak Bearish
Oil
Key news events today
API crude oil stock (8:30 pm GMT)
What can we expect from Oil today?
Oil markets are navigating a complex landscape characterized by oversupply concerns, subdued demand growth, and geopolitical uncertainties. While prices edged higher on Monday following optimism about the US government shutdown resolution, the fundamental picture remains bearish. OPEC+’s production pause for Q1 2026, Saudi Arabia’s significant price cuts for Asian buyers, and persistent inventory builds all point to a well-supplied market.
Next 24 Hours Bias
Medium Bearish
The post IC Markets – Asia Fundamental Forecast | 11 November 2025 first appeared on IC Markets | Official Blog.
Tuesday 11th November 2025: Asian Markets Mixed as U.S. Senate Moves to End Government Shutdown
423339 November 11, 2025 15:14 ICMarkets Market News
Global Markets:
- Asian Stock Markets : Nikkei up 0.57%, Shanghai Composite down -0.38%, Hang Seng down -0.37% ASX down -0.17%
- Commodities : Gold at $4,150.60 (0.69%), Silver at $50.776 (0.93%), Brent Oil at $64.00 (-0.09%), WTI Oil at $60.06 (-0.12%)
- Rates : US 10-year yield at 4.120, UK 10-year yield at 4.4640, Germany 10-year yield at 2.6658
News & Data:
- (EUR) Sentix Investor Confidence -7.4 to -3.9 expected
Markets Update:
Asian stock markets are trading mixed on Tuesday, following the broadly positive cues from Wall Street overnight, as traders welcome progress toward ending the record U.S. government shutdown. The U.S. Senate has begun voting on a temporary funding package to reopen the government, fueling optimism among investors. The move is expected to resume the release of key U.S. economic data ahead of next month’s Federal Reserve interest-rate decision. Traders also anticipate that signs of a slowing U.S. economy could push the Fed toward rate cuts.
The Australian market is slightly lower, with weakness in financial and tech sectors offsetting gains in mining and energy stocks. The S&P/ASX 200 is down 0.13 percent at 8,824.70. BHP, Rio Tinto, and Fortescue are marginally higher, while Mineral Resources gains over 4 percent. Oil stocks are mostly higher, and gold miners are rallying strongly. Among banks, Commonwealth Bank is down more than 6 percent, while Westpac and ANZ are up over 1 percent each.
In Japan, the Nikkei 225 is up 0.43 percent at 51,131.28, led by gains in SoftBank and Fast Retailing. Data showed bank lending rose 4.1 percent annually in October, while Japan’s current account surplus jumped 191.6 percent on year. Elsewhere in Asia, South Korea and Singapore are higher, while China and Indonesia are slightly lower.
Upcoming Events:
- 07:00 AM GMT – GBP Claimant Count Change
The post Tuesday 11th November 2025: Asian Markets Mixed as U.S. Senate Moves to End Government Shutdown first appeared on IC Markets | Official Blog.
IC Markets – Europe Fundamental Forecast | 11 November 2025
423338 November 11, 2025 15:14 ICMarkets Market News
IC Markets – Europe Fundamental Forecast | 11 November 2025
What happened in the Asia session?
The Asia session was dominated by risk-on market tone, thanks to hopes of a US government shutdown resolution and strong gains in US equities overnight.Macroeconomic data from New Zealand and the UK produced mild currency moves, with no surprises from NZD inflation and a modestly negative outcome for GBP. Gold surged on lingering risk-hedging needs, while Asian equity benchmarks broadly advanced.The JPY was the session’s biggest FX mover, weakening as traders shifted toward riskier assets.
What does it mean for the Europe & US sessions?
Global markets are experiencing a relief rally as progress toward ending the U.S. government shutdown removes a major source of uncertainty, with equities, gold, and risk assets all gaining. Key economic data from the UK this morning showed persistent wage pressures despite slowing growth, while traders await the ZEW sentiment survey and ECB commentary from Europe. The recent U.S.-China trade truce has provided temporary stability, though structural tensions remain. Federal Reserve officials are deeply divided on December rate cut prospects, with markets pricing in roughly 63% probability of easing.
The Dollar Index (DXY)
Key news events today
No major news event
What can we expect from DXY today?
The US dollar remains in a holding pattern as traders balance optimism about the potential end to the government shutdown against concerns about economic growth, consumer sentiment near multi-year lows, and uncertainty over the Fed’s rate path. With US banks closed for Veterans Day, market focus will shift to Fed speaker commentary on Wednesday for further clues about December policy. The fundamental backdrop favors caution, with the dollar likely to remain range-bound until key economic data resumes and provides clarity on the trajectory of growth and inflation.
Central Bank Notes:
- The Federal Open Market Committee (FOMC) voted, by majority, to lower the federal funds rate target range by 25 basis points to 3.75% — 4.00% at its October 28–29, 2025, meeting, marking the second consecutive cut following the 25 basis points reduction in September.
- The Committee maintained its long-term objectives of maximum employment and 2% inflation, noting that the labor market continues to soften, with modest job creation and an unemployment rate edging higher. In comparison, inflation remains above target at around 3.0%.
- Policymakers highlighted ongoing downside risks to economic growth, tempered by signs of resilient economic activity. September’s consumer price index (CPI) came in slightly lower than expected at 3.0% year-over-year, easing inflation pressure but still warranting vigilance given tariff-driven price effects.
- Economic activity expanded modestly in the third quarter, with GDP growth estimates around 1.0% annualized; however, uncertainty remains elevated amid persistent global trade tensions and the U.S. government shutdown, which is impacting data availability.
- The updated Summary of Economic Projections reflects an anticipated unemployment rate averaging approximately 4.5% for 2025, with headline and core personal consumption expenditures (PCE) inflation projections holding near 3.0%, indicating a slow easing path ahead.
- The Committee emphasized its flexible, data-dependent approach and underscored that future policy adjustments will be guided by incoming labor market and inflation data. As in prior meetings, there was dissent, including one member advocating a more aggressive 50-basis-point cut.
- The FOMC announced the planned conclusion of its balance sheet reduction (quantitative tightening) program, intending to cease runoff in the near term to maintain market stability, with Treasury redemption caps held steady at $5 billion per month and agency mortgage-backed securities caps at $35 billion.
- The next meeting is scheduled for 9 to 10 December 2025.
Next 24 Hours Bias
Weak Bullish
Gold (XAU)
Key news events today
No major news event
What can we expect from Gold today?
Gold’s strong performance reflects a convergence of supportive factors, including rising expectations of Federal Reserve rate cuts amid weak economic data, progress toward resolving the U.S. government shutdown, continued central bank purchases led by China, a softer U.S. dollar, and ongoing geopolitical uncertainties. The precious metal has broken through the psychologically significant $4,100 level, reaching a three-week high.
Next 24 Hours Bias
Medium Bullish
The Euro (EUR)
Key news events today
No major news event
What can we expect from EUR today?
The euro is consolidating near 1.1555 after recovering from early November lows. While the currency has stabilized, analysts expect continued range-bound trading with downside risks toward 1.1445 and upside potential capped around 1.1605-1.1835. The ECB’s commitment to holding rates steady contrasts with potential Fed easing, though persistent eurozone growth concerns and investor morale deterioration temper bullish expectations.
Central Bank Notes:
- The Governing Council of the ECB kept the three key interest rates unchanged at its 30 October 2025 meeting. The main refinancing rate remains at 2.15%, the marginal lending facility at 2.40%, and the deposit facility at 2.00%. This decision reflects policymakers’ assessment that the current monetary stance remains consistent with medium-term price stability, while incoming data confirm a gradual return of inflation towards the target.
- Recent indicators point to stable price dynamics. Headline inflation remains near the 2% mark, with energy prices contained and food inflation easing slightly after earlier supply bottlenecks. Wage growth continues to moderate, contributing to the slowdown in domestic cost pressures. The ECB reiterated its commitment to a data-driven, meeting-by-meeting approach and emphasized flexibility amid uncertain global financial conditions.
- Eurosystem staff projections have not been materially altered since September. Headline inflation averages remain at 2.0% for 2025, 1.8% for 2026, and 2.0% for 2027. Recent softening in producer prices and subdued pipeline pressures suggest limited upside risks to inflation, though geopolitical tensions and potential commodity shocks continue to pose uncertainties to the outlook.
- Euro area GDP growth remains on track with earlier forecasts, projected at 1.1% for 2025, 1.1% for 2026, and 1.4% for 2027. Forward-looking indicators, including PMIs and industrial sentiment surveys, signal some stabilization in activity following weakness in the third quarter. Public investment and recovering export activity are expected to offset softer private sector demand in the near term.
- The labor market remains resilient, with unemployment rates at multi-decade lows and participation rates strong. Real income growth continues to support household spending, even as consumption growth normalizes from earlier highs. Financing conditions remain favorable, aided by stable banking sector liquidity and improved credit demand among small and medium-sized firms.
- Business sentiment remains mixed, reflecting lingering uncertainty over global trade policy and the path of US tariffs. However, easing supply chain costs and improved export competitiveness due to softer exchange rates are providing some relief to manufacturing and external-oriented sectors.
- The Governing Council reaffirmed that future decisions will depend on an integrated assessment of incoming data—covering inflation trends, financial conditions, and the state of policy transmission. The Council emphasized that no pre-set path for rates exists; keeping all options open should the economic outlook shift markedly.
- Balance sheet reduction continues smoothly, with holdings under the APP and PEPP declining as reinvestments have ceased. The ECB confirmed that the pace of portfolio runoff remains in line with its previously communicated normalization plan, supporting a gradual withdrawal of monetary accommodation in a predictable manner.
- The next meeting is on 17 to 18 December 2025
Next 24 Hours Bias
Weak Bullish
The Swiss Franc (CHF)
Key news events today
No major news event
What can we expect from CHF today?
The Swiss franc exhibits mixed performance, maintaining long-term strength from safe-haven demand while showing short-term volatility against the dollar. Key developments include unexpectedly weak October inflation (0.1% y/y) sparking speculation about potential SNB rate cuts below zero, though policymakers currently signal comfort with the 0% rate until the December 11 meeting. The franc faces structural pressures from punitive US tariffs (39% on most goods), prompting downward revisions to Swiss growth forecasts for 2025-2026 to 1.3% and 0.9% respectively.
Central Bank Notes:
- The SNB maintained its key policy rate at 0% during its meeting on 25 September 2025, pausing a sequence of six consecutive rate cuts as inflation stabilized and the Swiss franc remained firm.
- Recent data showed a modest rebound in inflation, with Swiss consumer prices rising 0.2% year-on-year in August after staying above zero for three consecutive months; this helped alleviate fears of deflation that were mounting earlier in the year.
- The conditional inflation forecast remains broadly unchanged from June: headline inflation is expected to average 0.2% in 2025, 0.5% in 2026, and 0.7% in 2027. The risk of a negative rate move has diminished for now, but the SNB retains flexibility should inflationary pressures weaken again.
- The global economic outlook has deteriorated further, weighed down by heightened trade tensions—especially with the U.S.—and ongoing uncertainty in key Swiss export markets.
- Swiss GDP growth moderated in Q2 after a strong Q1 boosted by front-loaded U.S. exports. The SNB expects growth to slow and remain subdued, with forecasted GDP expansion between 1% and 1.5% in both 2025 and 2026.
- Labor market sentiment in the Swiss industrial sector has softened on concerns over export competitiveness and potential adjustments to production, but the overall growth outlook stays broadly unchanged
- The SNB reiterated its readiness to respond as needed if deflation risks re-emerge, emphasizing its commitment to medium-term price stability and a robust, transparent communication policy, with the introduction of more detailed monetary policy minutes beginning in October.
- The next meeting is on 11 December 2025.
Next 24 Hours Bias
Medium Bearish
The Pound (GBP)
Key news events today
Claimant Count Change (7:00 am GMT)
Average Earnings Index 3m/y (7:00 am GMT)
What can we expect from GBP today?
The British pound faces a pivotal week as critical employment data released today will significantly influence the Bank of England’s December rate decision. With Governor Bailey positioned as the swing voter favoring data-dependent easing, worse-than-expected unemployment or wage figures could cement expectations for a pre-Christmas rate cut. The upcoming Autumn Budget on November 26 adds further uncertainty, with potential tax increases weighing on the currency’s medium-term outlook.
Central Bank Notes:
- The Bank of England’s Monetary Policy Committee (MPC) met on 6 November 2025 and voted by a majority of 7–2 to keep the Bank Rate unchanged at 4.00 percent for a second consecutive meeting. The decision reflects the Committee’s cautious approach as inflation remains above target, but underlying economic momentum continues to weaken. Two members maintained their vote for a 25-basis-point cut, citing further signs of labor market softening and weak business sentiment.
- The BOE adjusted its guidance on quantitative tightening (QT), maintaining the reduced pace established in September. The planned reduction of UK government bond holdings remains at £67.5 billion over the next 12 months, leaving the current gilt balance near £550 billion. Policymakers described the recalibrated QT path as “appropriate for current market conditions,” emphasizing the importance of liquidity management amid heightened volatility.
- Headline inflation moderated slightly to 3.6 percent in October from 3.8 percent previously, driven by easing food and transport prices. However, core inflation has shown only gradual progress, holding near 3.9 percent. The MPC noted that services inflation and administered energy costs continue to exert pressure, highlighting the challenge of achieving the 2 percent target sustainably. The Committee’s latest projections see inflation falling toward 3 percent by mid-2026, with further downside expected if energy and wage dynamics continue to normalize.
- Economic activity remains subdued. Estimates place Q3 GDP growth close to zero, with both business output and consumer spending restrained. The unemployment rate has edged up to 4.8 percent, while pay growth cooled to just under 5 percent year-on-year. MPC members acknowledged that pay settlements are weakening further, signaling an easing in labor cost pressures as demand softens. Surveys from the manufacturing and services sectors suggest muted hiring intentions through year-end.
- International factors continue to complicate the policy outlook. Fluctuating oil prices—partly linked to renewed Middle East tensions—alongside fragile global demand have contributed to higher market volatility. The MPC reiterated that external shocks, including global food and energy disruptions, could temporarily slow the disinflation path but remain unlikely to derail the medium-term moderation in prices.
- The Committee assessed risks around inflation as balanced. Downside risks arise from sluggish domestic growth and declining real income momentum, while upside risks remain tied to elevated inflation expectations and stubborn services inflation. Policymakers emphasized the need for patience, maintaining that any rate cuts ahead of clear inflation progress could undermine confidence in policy credibility.
- The MPC’s overall stance remains restrictive but increasingly balanced, with future moves expected to follow a cautious, data-driven trajectory. The Committee reaffirmed that monetary policy will stay tight until there is compelling evidence that inflation is returning to the 2 percent target on a durable basis.
- The next meeting is on 18 December 2025.
Next 24 Hours Bias
Weak Bullish
The Canadian Dollar (CAD)
Key news events today
No major news event
What can we expect from CAD today?
The Canadian Dollar strengthened on November 11, 2025, with USD/CAD trading around 1.4020 as robust employment data, higher oil prices, and US Dollar weakness supported the loonie. Canada added 66,600 jobs in October versus expectations of a 2,500 decline, pushing unemployment down to 6.9% and wages up to 3.5% year-over-year. This data reinforces expectations that the Bank of Canada may pause its rate-cutting cycle after lowering rates to 2.25% in October.
Central Bank Notes:
- The Council noted that U.S. tariff tensions have eased slightly following early progress in bilateral discussions, though the external trade environment remains fragile. Businesses continue to hold back on long-term investment, with the Bank highlighting that sustained clarity on U.S. trade policy is needed to restore confidence.
- The Bank acknowledged that uncertainty persists despite the softer U.S. tone, as incoming data show limited improvement in export orders. The manufacturing sector has stabilized but remains below pre-2024 output levels, reflecting weak global demand and cautious corporate spending.
- Canada’s economy showed tentative signs of recovery in early Q4, with GDP estimated to expand by 0.3% in October after two quarters of contraction. Mining and energy activity strengthened modestly, aided by steady crude demand, while goods exports posted a fractional gain.
- Service sector growth remained uneven, supported mainly by tourism-related and technology services. However, retail spending and household consumption were subdued, constrained by slower job creation and lingering consumer caution. The Bank judged overall momentum as fragile but improving marginally.
- Housing activity showed modest reacceleration in major urban markets as mortgage rates stabilized near record lows. Nonetheless, affordability pressures and stricter lending standards continue to cap overall resale volumes, leading to only a gradual recovery in the housing sector.
- Headline CPI inflation rose to 2.1% in October, reaching the Bank’s target for the first time in six months. Higher energy prices and a modest uptick in food and shelter costs drove the increase. Core inflation measures remained stable, suggesting underlying price pressures are contained.
- The Governing Council reiterated its data-dependent stance, indicating that the current policy rate remains appropriate amid tentative growth and balanced inflation risks. Officials noted that while additional stimulus is not ruled out, the emphasis has shifted toward monitoring the sustainability of the recovery rather than immediate rate adjustments.
- The next meeting is on 17 to 18 December 2025.
Next 24 Hours Bias
Medium Bullish
Oil
Key news events today
API crude oil stock (8:30 pm GMT)
What can we expect from Oil today?
Oil prices slipped as oversupply concerns continue to weigh on market sentiment despite recent US sanctions on major Russian oil producers. WTI traded near $60 per barrel while Brent hovered around $64, with both benchmarks consolidating after a modest Monday gain. The market faces a growing surplus as OPEC+ increases production by 137,000 barrels per day monthly while global demand growth remains anemic at just 710,000 barrels per day—far below historical averages.
Next 24 Hours Bias
Medium Bearish
The post IC Markets – Europe Fundamental Forecast | 11 November 2025 first appeared on IC Markets | Official Blog.
Ex-Dividend 11/11/2025
423310 November 10, 2025 16:39 ICMarkets Market News
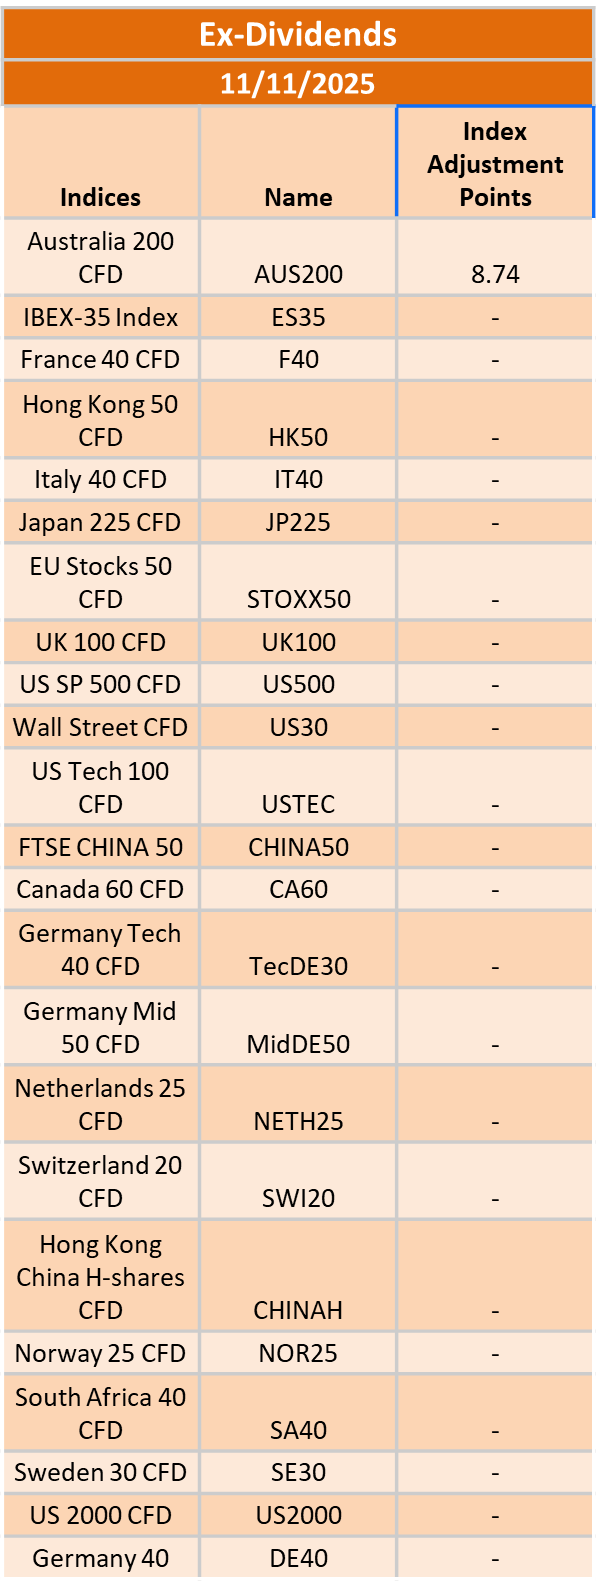
The post Ex-Dividend 11/11/2025 first appeared on IC Markets | Official Blog.
General Market Analysis – 10/11/25
423308 November 10, 2025 16:14 ICMarkets Market News
Investor Concerns Weigh on Stocks into the Weekend – Nasdaq down 0.2%
US stocks closed out the week on a mixed note as ongoing concerns over the government shutdown continued to weigh on investor sentiment. The Dow managed to edge higher, closing up 0.16% at 46,987, while the S&P 500 added 0.13% to finish at 6,728. The tech-heavy Nasdaq lagged behind once again, slipping 0.21% to 23,004. In the bond market, US Treasury yields nudged higher into the close, with the 2-year up 0.6 basis points to 3.562% and the 10-year rising 1.3 basis points to 4.097%. The dollar gave back more of its recent gains, with the DXY easing 0.18% to 99.56 against the majors. Commodities saw a firmer tone, with Brent crude climbing 0.39% to $63.63 and WTI up 0.54% to $59.75 as traders took advantage of the recent dip. Gold extended its recent run, gaining another 0.6% to $4,001.26 as uncertainty around Washington continued to fuel safe-haven demand.
US Government Shutdown in Focus
The longest US government shutdown in history has placed further pressure on US markets that some commentators were already calling well overvalued. However, updates on Friday and over the weekend are pointing to a possible resolution in the coming days, which could see the resumption of key US economic data. The economic calendar was looking very bare at the start of the week; however, if US agencies are back in action in the next couple of days, we could see scheduled CPI, PPI, and Retail Sales numbers released later this week. Given the data vacuum of the last few weeks, if we do start to see numbers released in the coming days, then expect plenty of volatility around them. Even if we do see the government back at work in the next couple of days, there will be a backlog to get through, so investors are not counting on set data releases. However, the return to work will be seen as a positive for markets, and it will remain to be seen if the data backs up that optimism.
Quiet Calendar Day to Kick Off the Week
It looks like being a quiet start to the trading week today, with very little on the macroeconomic calendar to inspire fresh moves in the market. All eyes remain on the US for updates on whether the longest-running government shutdown in history is about to come to an end, with hopes increasing over the weekend leading to a positive start for Asian bourses today. All three trading sessions are lacking any tier-one data or central bank updates today; however, yen traders will be paying close attention to the Bank of Japan Summary of Opinions early in the Japanese day. The latter two sessions of the day will most probably see the main focus remain on the US and any progress with regard to the shutdown; however, as always, traders will not discount any further geopolitical updates from adding some volatility to proceedings.
The post General Market Analysis – 10/11/25 first appeared on IC Markets | Official Blog.
The Week Ahead – Week Commencing 10 November 2025
423302 November 10, 2025 16:14 ICMarkets Market News
Investor concerns with regard to the state of the US economy are certainly starting to creep in, with US stocks experiencing their first down week in a month as the government shutdown reaches new records and the consequent data vacuum continues. This comes despite a relatively upbeat earnings season from major US companies.
The macroeconomic calendar looks considerably barer in the days ahead than it would normally, with US markets looking to less reliable secondary data updates for clues on the health of the economy.
It has (so far) been a relatively quiet weekend in terms of geopolitical surprises, and so most traders are expecting to see relatively smooth trading conditions to kick off the coming week.
Here is our usual day-by-day breakdown of the major risk events this week:

It should be a relatively quiet start to the week for traders, with very little of note on the calendar across all three sessions on Monday. Slightly stronger Chinese inflation numbers may see the Asian markets start on the front foot; however, most traders are expecting relatively calm conditions through the day.

The economic calendar does pick up on Tuesday with some key data due out, and holidays in key centres are likely to lead to lower liquidity. The Asian market will see an early focus on New Zealand, with key inflation expectations data due out, while the London session sees the release of crucial employment data out of the UK. Holidays in France, Canada, and the US should see liquidity levels much lower, especially towards the end of the day

Another quiet day in terms of data releases, with very little of note on the calendar to move markets. There is a plethora of Fed members due to speak in the New York session that should spice things up a bit later in the day, with members Williams, Paulson, Waller, Bostic, and Miran all scheduled to speak.

Australian markets will be in focus during the Asian session on Thursday as employment data is released midway through the Sydney day. UK markets are again in focus at the London open, with a big data drop scheduled, and GDP numbers likely to be the highlight. US CPI data would be planned for the New York session today, but with the ongoing government shutdown, we are unlikely to see that released this week. US Crude Oil Inventory data will be released during the session, and we also hear from the Fed’s Musalem and Hammack later in the day

Chinese markets will be in focus for the Asian session on Friday, with a large data drop midway through the day. Industrial Production, Retail Sales, and the Unemployment Rate figures are all due to be released. There is very little on the cards for the rest of the day; once again, key US numbers would normally be released—this time the PPI and Retail Sales data—however, the odds look slim at this point. We do, however, hear from more Fed members, with members Bostic, Schmid, and Logan all set to speak towards the end of the day.
The post The Week Ahead – Week Commencing 10 November 2025 first appeared on IC Markets | Official Blog.
IC Markets – Europe Fundamental Forecast | 10 November 2025
423301 November 10, 2025 16:00 ICMarkets Market News
IC Markets – Europe Fundamental Forecast | 10 November 2025
What happened in the Asia session?
Today’s Asia session was marked by a mild upside surprise in Chinese inflation, BOJ rate hike discussions driving safe-haven JPY demand, and selective rebounds in Asian equities amid ongoing global growth uncertainties. U.S. government shutdown negotiations, major earnings releases, and divergence in monetary policy, especially between Australia and New Zealand, influenced FX and commodities sharply. This environment produced volatility in USD/JPY, AUD/NZD, Asian stock indexes, and commodities.
What does it mean for the Europe & US sessions?
Today’s Asia session was marked by a mild upside surprise in Chinese inflation, BOJ rate hike discussions driving safe-haven JPY demand, and selective rebounds in Asian equities amid ongoing global growth uncertainties. U.S. government shutdown negotiations, major earnings releases, and divergence in monetary policy, especially between Australia and New Zealand, influenced FX and commodities sharply. This environment produced volatility in USD/JPY, AUD/NZD, Asian stock indexes, and commodities.
The Dollar Index (DXY)
Key news events today
No major news event
What can we expect from DXY today?
The Dollar is steady but facing mixed signals: growth concerns and political risk keep it bid, but relief in the shutdown or new data could change direction quickly this week. If the government shutdown ends soon, markets expect renewed focus on inflation and producer price index figures, which could move the Dollar sharply depending on the results.A protracted shutdown will likely keep the Dollar steady but prone to choppy, indecisive trading until new data is available.Fed officials remain cautious about cutting rates further, despite ongoing inflation above target, which prevents aggressive Dollar weakening for now.
Central Bank Notes:
- The Federal Open Market Committee (FOMC) voted, by majority, to lower the federal funds rate target range by 25 basis points to 3.75%–4.00% at its October 28–29, 2025, meeting, marking the second consecutive cut following the 25 basis points reduction in September.
- The Committee maintained its long-term objectives of maximum employment and 2% inflation, noting that the labor market continues to soften, with modest job creation and an unemployment rate edging higher. In comparison, inflation remains above target at around 3.0%.
- Policymakers highlighted ongoing downside risks to economic growth, tempered by signs of resilient economic activity. September’s consumer price index (CPI) came in slightly lower than expected at 3.0% year-over-year, easing inflation pressure but still warranting vigilance given tariff-driven price effects.
- Economic activity expanded modestly in the third quarter, with GDP growth estimates around 1.0% annualized; however, uncertainty remains elevated amid persistent global trade tensions and the U.S. government shutdown, which is impacting data availability.
- The updated Summary of Economic Projections reflects an anticipated unemployment rate averaging approximately 4.5% for 2025, with headline and core personal consumption expenditures (PCE) inflation projections holding near 3.0%, indicating a slow easing path ahead.
- The Committee emphasized its flexible, data-dependent approach and underscored that future policy adjustments will be guided by incoming labor market and inflation data. As in prior meetings, there was dissent, including one member advocating a more aggressive 50-basis-point cut.
- The FOMC announced the planned conclusion of its balance sheet reduction (quantitative tightening) program, intending to cease runoff in the near term to maintain market stability, with Treasury redemption caps held steady at $5 billion per month and agency mortgage-backed securities caps at $35 billion.
- The next meeting is scheduled for 9 to 10 December 2025.
Next 24 Hours Bias
Weak Bullish
Gold (XAU)
Key news events today
No major news event
What can we expect from Gold today?
Gold prices are stabilizing after a period of volatility, currently trading near $4,010–$4,050 per ounce, with the market closely watching U.S. economic developments and upcoming key macroeconomic data. The yellow metal has moved into a corrective phase after a record rally, influenced by profit-taking, a slightly stronger U.S. dollar, and continued speculation on potential Federal Reserve rate cuts in December.
Next 24 Hours Bias
Medium Bullish
The Euro (EUR)
Key news events today
No major news event
What can we expect from EUR today?
The euro opened the week somewhat weaker as global markets reacted to ongoing uncertainties and awaited key economic data out of the Eurozone. Market participants are closely watching the incoming data for clues on future growth and monetary policy trends, which will likely determine the next major moves in the euro’s exchange rate. The Euro slipped 0.1% to around $1.155 at the open of Asian trading, reflecting a weaker posture compared to recent sessions.
Central Bank Notes:
- The Governing Council of the ECB kept the three key interest rates unchanged at its 30 October 2025 meeting. The main refinancing rate remains at 2.15%, the marginal lending facility at 2.40%, and the deposit facility at 2.00%. This decision reflects policymakers’ assessment that the current monetary stance remains consistent with medium-term price stability, while incoming data confirm a gradual return of inflation towards the target.
- Recent indicators point to stable price dynamics. Headline inflation remains near the 2% mark, with energy prices contained and food inflation easing slightly after earlier supply bottlenecks. Wage growth continues to moderate, contributing to the slowdown in domestic cost pressures. The ECB reiterated its commitment to a data-driven, meeting-by-meeting approach and emphasized flexibility amid uncertain global financial conditions.
- Eurosystem staff projections have not been materially altered since September. Headline inflation averages remain at 2.0% for 2025, 1.8% for 2026, and 2.0% for 2027. Recent softening in producer prices and subdued pipeline pressures suggest limited upside risks to inflation, though geopolitical tensions and potential commodity shocks continue to pose uncertainties to the outlook.
- Euro area GDP growth remains on track with earlier forecasts, projected at 1.1% for 2025, 1.1% for 2026, and 1.4% for 2027. Forward-looking indicators, including PMIs and industrial sentiment surveys, signal some stabilization in activity following weakness in the third quarter. Public investment and recovering export activity are expected to offset softer private sector demand in the near term.
- The labor market remains resilient, with unemployment rates at multi-decade lows and participation rates strong. Real income growth continues to support household spending, even as consumption growth normalizes from earlier highs. Financing conditions remain favorable, aided by stable banking sector liquidity and improved credit demand among small and medium-sized firms.
- Business sentiment remains mixed, reflecting lingering uncertainty over global trade policy and the path of US tariffs. However, easing supply chain costs and improved export competitiveness due to softer exchange rates are providing some relief to manufacturing and external-oriented sectors.
- The Governing Council reaffirmed that future decisions will depend on an integrated assessment of incoming data—covering inflation trends, financial conditions, and the state of policy transmission. The Council emphasized that no pre-set path for rates exists; keeping all options open should the economic outlook shift markedly.
- Balance sheet reduction continues smoothly, with holdings under the APP and PEPP declining as reinvestments have ceased. The ECB confirmed that the pace of portfolio runoff remains in line with its previously communicated normalization plan, supporting a gradual withdrawal of monetary accommodation in a predictable manner.
- The next meeting is on 17 to 18 December 2025
Next 24 Hours Bias
Weak Bullish
The Swiss Franc (CHF)
Key news events today
No major news event
What can we expect from CHF today?
The Swiss franc remains exceptionally strong in early November 2025, supported by safe-haven demand amid global uncertainties. Key developments include promising progress in US tariff negotiations following high-level business meetings with President Trump, though a final deal depends on the US president’s decision. Switzerland’s economic outlook has deteriorated, with GDP growth forecasts slashed to 0.9% for 2026 due to tariff impacts, while Q2 growth slowed to just 0.1%. Inflation has fallen to 0.1%, sparking rate cut speculation, but SNB policymakers signal comfort with current 0% rates ahead of the December 11 meeting.
Central Bank Notes:
- The SNB maintained its key policy rate at 0% during its meeting on 25 September 2025, pausing a sequence of six consecutive rate cuts as inflation stabilized and the Swiss franc remained firm.
- Recent data showed a modest rebound in inflation, with Swiss consumer prices rising 0.2% year-on-year in August after staying above zero for three consecutive months; this helped alleviate fears of deflation that were mounting earlier in the year.
- The conditional inflation forecast remains broadly unchanged from June: headline inflation is expected to average 0.2% in 2025, 0.5% in 2026, and 0.7% in 2027. The risk of a negative rate move has diminished for now, but the SNB retains flexibility should inflationary pressures weaken again.
- The global economic outlook has deteriorated further, weighed down by heightened trade tensions—especially with the U.S.—and ongoing uncertainty in key Swiss export markets.
- Swiss GDP growth moderated in Q2 after a strong Q1 boosted by front-loaded U.S. exports. The SNB expects growth to slow and remain subdued, with forecasted GDP expansion between 1% and 1.5% in both 2025 and 2026.
- Labor market sentiment in the Swiss industrial sector has softened on concerns over export competitiveness and potential adjustments to production, but the overall growth outlook stays broadly unchanged
- The SNB reiterated its readiness to respond as needed if deflation risks re-emerge, emphasizing its commitment to medium-term price stability and a robust, transparent communication policy, with the introduction of more detailed monetary policy minutes beginning in October.
- The next meeting is on 11 December 2025.
Next 24 Hours Bias
Medium Bearish
The Pound (GBP)
Key news events today
No major news event
What can we expect from GBP today?
The British pound opened Monday’s session near seven-month lows around 1.3150 against the US dollar, pressured by renewed dollar strength as the US government shutdown nears resolution. Last week’s Bank of England decision, which saw four of nine members vote for an immediate rate cut, has reinforced expectations for December easing, with markets pricing in 66% odds of a 25bp cut. Key factors weighing on sterling include the unemployment rate reaching a four-year high of 4.8%, ongoing fiscal concerns ahead of the November 26 Budget, where tax increases totaling £20-35 billion may be needed
Central Bank Notes:
- The Bank of England’s Monetary Policy Committee (MPC) met on 6 November 2025 and voted by a majority of 7–2 to keep the Bank Rate unchanged at 4.00 percent for a second consecutive meeting. The decision reflects the Committee’s cautious approach as inflation remains above target, but underlying economic momentum continues to weaken. Two members maintained their vote for a 25-basis-point cut, citing further signs of labor market softening and weak business sentiment.
- The BOE adjusted its guidance on quantitative tightening (QT), maintaining the reduced pace established in September. The planned reduction of UK government bond holdings remains at £67.5 billion over the next 12 months, leaving the current gilt balance near £550 billion. Policymakers described the recalibrated QT path as “appropriate for current market conditions,” emphasizing the importance of liquidity management amid heightened volatility.
- Headline inflation moderated slightly to 3.6 percent in October from 3.8 percent previously, driven by easing food and transport prices. However, core inflation has shown only gradual progress, holding near 3.9 percent. The MPC noted that services inflation and administered energy costs continue to exert pressure, highlighting the challenge of achieving the 2 percent target sustainably. The Committee’s latest projections see inflation falling toward 3 percent by mid-2026, with further downside expected if energy and wage dynamics continue to normalize.
- Economic activity remains subdued. Estimates place Q3 GDP growth close to zero, with both business output and consumer spending restrained. The unemployment rate has edged up to 4.8 percent, while pay growth cooled to just under 5 percent year-on-year. MPC members acknowledged that pay settlements are weakening further, signaling an easing in labor cost pressures as demand softens. Surveys from the manufacturing and services sectors suggest muted hiring intentions through year-end.
- International factors continue to complicate the policy outlook. Fluctuating oil prices—partly linked to renewed Middle East tensions—alongside fragile global demand have contributed to higher market volatility. The MPC reiterated that external shocks, including global food and energy disruptions, could temporarily slow the disinflation path but remain unlikely to derail the medium-term moderation in prices.
- The Committee assessed risks around inflation as balanced. Downside risks arise from sluggish domestic growth and declining real income momentum, while upside risks remain tied to elevated inflation expectations and stubborn services inflation. Policymakers emphasized the need for patience, maintaining that any rate cuts ahead of clear inflation progress could undermine confidence in policy credibility.
- The MPC’s overall stance remains restrictive but increasingly balanced, with future moves expected to follow a cautious, data-driven trajectory. The Committee reaffirmed that monetary policy will stay tight until there is compelling evidence that inflation is returning to the 2 percent target on a durable basis.
- The next meeting is on 18 December 2025.
Next 24 Hours Bias
Weak Bullish
The Canadian Dollar (CAD)
Key news events today
No major news event
What can we expect from CAD today?
The Canadian dollar faces multiple headwinds as it enters the week of November 10, 2025, with USD/CAD consolidating near 1.40 after reaching seven-month highs. The 150+ basis point interest rate differential favoring the US dollar remains the dominant driver, reinforced by the Bank of Canada’s signal that it has likely finished its easing cycle at 2.25%. Strong October employment data—adding 66,600 jobs and pushing unemployment down to 6.9%—has solidified expectations for a prolonged BoC rate pause.
Central Bank Notes:
- The Council noted that U.S. tariff tensions have eased slightly following early progress in bilateral discussions, though the external trade environment remains fragile. Businesses continue to hold back on long-term investment, with the Bank highlighting that sustained clarity on U.S. trade policy is needed to restore confidence.
- The Bank acknowledged that uncertainty persists despite the softer U.S. tone, as incoming data show limited improvement in export orders. The manufacturing sector has stabilized but remains below pre-2024 output levels, reflecting weak global demand and cautious corporate spending.
- Canada’s economy showed tentative signs of recovery in early Q4, with GDP estimated to expand by 0.3% in October after two quarters of contraction. Mining and energy activity strengthened modestly, aided by steady crude demand, while goods exports posted a fractional gain.
- Service sector growth remained uneven, supported mainly by tourism-related and technology services. However, retail spending and household consumption were subdued, constrained by slower job creation and lingering consumer caution. The Bank judged overall momentum as fragile but improving marginally.
- Housing activity showed modest reacceleration in major urban markets as mortgage rates stabilized near record lows. Nonetheless, affordability pressures and stricter lending standards continue to cap overall resale volumes, leading to only a gradual recovery in the housing sector.
- Headline CPI inflation rose to 2.1% in October, reaching the Bank’s target for the first time in six months. Higher energy prices and a modest uptick in food and shelter costs drove the increase. Core inflation measures remained stable, suggesting underlying price pressures are contained.
- The Governing Council reiterated its data-dependent stance, indicating that the current policy rate remains appropriate amid tentative growth and balanced inflation risks. Officials noted that while additional stimulus is not ruled out, the emphasis has shifted toward monitoring the sustainability of the recovery rather than immediate rate adjustments.
- The next meeting is on 17 to 18 December 2025.
Next 24 Hours Bias
Medium Bullish
Oil
Key news events today
No major news event
What can we expect from Oil today?
Monday’s oil market opened with modest gains driven primarily by optimism over the pending U.S. government shutdown resolution, which is expected to restore consumer spending and economic activity. However, significant bearish headwinds persist: Saudi Arabia’s aggressive price cuts to Asia signal weak demand and intense competition for market share; U.S. crude inventories posted their largest weekly build since July; and the global market faces a looming supply glut in 2026 as production growth dramatically outpaces sluggish demand.
Next 24 Hours Bias
Medium Bearish
The post IC Markets – Europe Fundamental Forecast | 10 November 2025 first appeared on IC Markets | Official Blog.
IC Markets – Asia Fundamental Forecast | 10 November 2025
423300 November 10, 2025 16:00 ICMarkets Market News
IC Markets – Asia Fundamental Forecast | 10 November 2025
What happened in the U.S. session?
The most significant influences overnight were the persistent government shutdown, missing/delayed key macro data, and shifting expectations around the Fed’s next move. U.S. equities (especially tech), the dollar, and Treasuries were the most responsive, with volatility underscored by the lack of official data and growing reliance on private surveys or alternative indicators. Commodities like oil also saw stabilization amid the policy flux.
What does it mean for the Asia Session?
Monday, November 10, presents a relatively quiet start to the trading week for Asian markets, with limited tier-one economic data scheduled. The session follows a volatile week marked by sharp corrections in the technology sector, which erased recent gains across regional benchmarks, most notably in South Korea and Japan, where losses among chipmakers were particularly pronounced.
The Dollar Index (DXY)
Key news events today
No major news event
What can we expect from DXY today?
As Monday trading begins, the US dollar faces a confluence of challenging factors: an unprecedented government shutdown creating data uncertainty, divided Fed officials sending mixed policy signals, and technical resistance near the 100.00 level capping upside momentum. While the dollar has shown resilience amid safe-haven flows and maintained support above 99.00, the path forward remains highly uncertain pending resolution of the shutdown and clarity on the Fed’s December decision.
Central Bank Notes:
- The Federal Open Market Committee (FOMC) voted, by majority, to lower the federal funds rate target range by 25 basis points to 3.75%–4.00% at its October 28–29, 2025, meeting, marking the second consecutive cut following the 25 basis points reduction in September.
- The Committee maintained its long-term objectives of maximum employment and 2% inflation, noting that the labor market continues to soften, with modest job creation and an unemployment rate edging higher. In comparison, inflation remains above target at around 3.0%.
- Policymakers highlighted ongoing downside risks to economic growth, tempered by signs of resilient economic activity. September’s consumer price index (CPI) came in slightly lower than expected at 3.0% year-over-year, easing inflation pressure but still warranting vigilance given tariff-driven price effects.
- Economic activity expanded modestly in the third quarter, with GDP growth estimates around 1.0% annualized; however, uncertainty remains elevated amid persistent global trade tensions and the U.S. government shutdown, which is impacting data availability.
- The updated Summary of Economic Projections reflects an anticipated unemployment rate averaging approximately 4.5% for 2025, with headline and core personal consumption expenditures (PCE) inflation projections holding near 3.0%, indicating a slow easing path ahead.
- The Committee emphasized its flexible, data-dependent approach and underscored that future policy adjustments will be guided by incoming labor market and inflation data. As in prior meetings, there was dissent, including one member advocating a more aggressive 50-basis-point cut.
- The FOMC announced the planned conclusion of its balance sheet reduction (quantitative tightening) program, intending to cease runoff in the near term to maintain market stability, with Treasury redemption caps held steady at $5 billion per month and agency mortgage-backed securities caps at $35 billion.
- The next meeting is scheduled for 9 to 10 December 2025.
Next 24 Hours Bias
Weak Bearish
Gold (XAU)
Key news events today
No major news event
What can we expect from Gold today?
Gold enters the week consolidating near $4,000 per ounce after three consecutive weeks of declines totaling approximately 8-9% from October’s record high of $4,381. The correction reflects reduced Federal Reserve rate-cut expectations (now 66-70% probability for December versus 90%+ previously), dollar strength reaching three-month highs, and profit-taking following 2025’s spectacular 50%+ rally.
Next 24 Hours Bias
Weak Bullish
The Australian Dollar (AUD)
Key news events today
No major news event
What can we expect from AUD today?
The Australian dollar begins the week of November 10 under moderate pressure, trading near 0.6470 with a bearish technical bias pointing toward potential tests of 0.6400 support. The RBA’s hawkish hold at 3.60%, driven by persistently elevated inflation expected to remain above target until mid-2026, has effectively ended the rate-cutting cycle and limited the AUD’s upside potential. While improving China-Australia trade relations and strong domestic property price growth (up 6.1% annually) provide some support, headwinds from falling commodity prices, subdued consumer spending, and a second consecutive week of losses for the ASX 200 are weighing on sentiment
Central Bank Notes:
- The Reserve Bank of Australia held its cash rate steady at 3.60% at the November policy meeting, citing persistent inflationary pressures and lingering uncertainties in both domestic and global outlooks. This is the third consecutive pause following the cut in August.
- Policymakers remain alert to renewed inflation momentum. After a temporary uptick in September’s CPI, trimmed mean inflation for Q3 stands at 3.0%, above the intended 2–3% band. The RBA now anticipates that core inflation will stay above target until at least mid-2026, delaying any hopes of further easing.
- Headline CPI climbed by 3.2% in the year to September 2025, driven by resilient housing (+2.5%) and insurance costs, while discretionary goods inflation is subdued. The transition to monthly CPI reporting from November will improve the accuracy of inflation tracking.
- Domestic demand remains firm, particularly in services and housing, while manufacturing and discretionary retail continue to lag. Household incomes have stabilized, but high borrowing costs and elevated rents are constraining consumption and risking a slowdown in Q1 2026.
- Labor market tightness persists, though job growth has moderated. Underutilization edged higher. Wage growth is plateauing, but weak productivity is keeping unit labor costs elevated—a medium-term risk that remains central to the Board’s narrative.
- The RBA highlights geopolitical tensions and volatile commodity markets as primary global risks, against a backdrop of modest upward revisions to world growth forecasts. The Board stresses that its stance remains “cautious and data-dependent,” with ongoing vigilance on inflation, labor, and spending trends.
- Monetary policy remains mildly restrictive, balancing progress on price stability against vulnerabilities in household demand and global outlook. Board communications reaffirm a dual mandate: price stability and full employment, while underscoring readiness to respond should risks materialize sharply.
- Analysts generally expect the cash rate to remain at current levels through early 2026, with only modest cuts possible later in the year if inflation moderates. The new monthly CPI release (first full edition Nov 2025) will be watched closely for timely signals on price trends.
- The next meeting is on 9 December 2025.
Next 24 Hours Bias
Weak Bearish
The Kiwi Dollar (NZD)
Key news events today
No major news event
What can we expect from NZD today?
New Zealand faces multiple headwinds as the economy continues its slow recovery from recession. The NZD has weakened significantly amid expectations of further RBNZ rate cuts following weak employment data and soft economic indicators. Major developments include the devastating Tongariro wildfire requiring massive firefighting resources, a diplomatic crisis with the Cook Islands over China relations resulting in suspended aid, and government initiatives to boost business investment and technology innovation.
Central Bank Notes:
- The Monetary Policy Committee (MPC) agreed to cut the Official Cash Rate (OCR) by 50 basis points to 2.50% on 8 October 2025, exceeding market expectations for a smaller 25-basis-point reduction and signaling a stronger commitment to reviving growth.
- The decision was reached by consensus, marking a shift from previous split votes, and reflected policymakers’ shared view that sustained economic weakness and persistent disinflationary pressures required a more front-loaded policy response.
- Annual consumer price inflation stood at 2.7% in the June quarter and is seen nearing 3% for the September quarter—above the 2% midpoint but within the 1–3% target range. Despite high near-term readings, the MPC projects inflation will return toward 2% by the first half of 2026 as spare capacity and moderating tradables curb price momentum.
- Policymakers acknowledged that domestic demand remains weak, with household spending, business investment, and construction activity under pressure. While still elevated, services inflation is expected to ease gradually as wage growth slows and unemployment edges higher.
- Financial conditions have eased with expectations as wholesale and retail borrowing rates adjust to lower policy settings. Bank lending data indicate a modest uptick in mortgage approvals, though broader credit demand remains subdued.
- GDP growth stalled in the middle of 2025, with high-frequency indicators showing continued weakness into the third quarter. A combination of elevated costs for essentials and falling savings continues to restrain household consumption, while global trade frictions weigh on business sentiment.
- The MPC noted that global uncertainty—particularly from US trade regulation changes and soft Chinese demand—continues to pose downside risks to export sectors, though these are partly offset by a weaker New Zealand dollar improving competitiveness.
- Subject to data confirming a sustained soft patch in activity and moderating inflation pressures, the MPC signaled further scope to reduce the OCR toward 2.25% at its next meeting on 26 November 2025, consistent with current market and Westpac forecasts.
- The next meeting is on 26 November 2025.
Next 24 Hours Bias
Medium Bearish
The Japanese Yen (JPY)
Key news events today
No major news events
What can we expect from JPY today?
The Japanese yen faces a complex interplay of factors on Monday, November 10, 2025. The Bank of Japan’s Summary of Opinions will be scrutinized for rate hike signals amid persistent inflation above the 2% target, though falling real wages and economic contraction in Q3 complicate the tightening case. Finance Minister Katayama’s intervention warnings suggest tolerance is wearing thin as USD/JPY approaches 155, but actual action appears unlikely below 158-160.
Central Bank Notes:
- The Policy Board of the Bank of Japan met on 30–31 October and, by a clear majority vote, decided to maintain its key monetary policy approach for the upcoming period.
- The BOJ will continue to encourage the uncollateralized overnight call rate to remain at around 0.5%, in line with the prior stance.
- The gradual quarterly reduction in monthly outright purchases of Japanese Government Bonds (JGBs) remains intact, with amounts unchanged from the previous schedule. Purchases are set to decrease by about ¥400 billion per quarter through March 2026, shifting to about ¥200 billion per quarter from April to June 2026, and targeting a ¥2 trillion purchase level for Q1 2027. The bank reaffirmed its intention to maintain flexibility, with readiness to respond if market conditions warrant an adjustment.
- Japan’s economy continues to show moderate recovery, primarily led by solid capital expenditures, although export growth and corporate activity remain restrained by external demand uncertainty and the ongoing effects of U.S. trade policies.
- Annual headline inflation (excluding fresh food) accelerated to 2.9% year-on-year in September, marking the first uptick in four months and staying above the BOJ’s 2% target. Broad-based inflation persists, with food and energy cost pressures, but wage growth continues to support household consumption. Input cost pressures from the earlier surge in imports eased slightly.
- Short-term inflation momentum could moderate as food-price hikes ease, though rent, healthcare, and service-sector price increases tied to labor shortages provide support. Firms and households maintain a gradual upward drift in inflation expectations.
- For the near term, BOJ projects growth below trend as external demand stays subdued and corporate investment plans remain cautious. Still, accommodative financial conditions and steady gains in real labor income will underpin domestic consumption.
- Over the medium term, as overseas economies recover and trade conditions normalize, Japan’s growth potential should improve. Persistent labor market tightness, higher wage settlements, and rising medium- to long-term inflation expectations are expected to keep core inflation on a gradual upward trajectory, converging toward the 2% price stability target later in the forecast horizon.
- The next meeting is scheduled for 18 to 19 December 2025.
Next 24 Hours Bias
Weak Bearish
Oil
Key news events today
No major news event
What can we expect from Oil today?
The oil market is facing persistent bearish pressure from multiple fronts. WTI crude hovers precariously around the $60 psychological level while Brent struggles near $64, both on track for extended declines. The fundamental backdrop is dominated by oversupply concerns, with OPEC+ pausing Q1 2026 production increases and Saudi Arabia aggressively cutting prices to defend Asian market share. U.S. crude inventories surged by 5.2 million barrels in the latest week, while global demand growth remains anemic at 0.7-0.8% year-on-year.
Next 24 Hours Bias
Medium Bearish
The post IC Markets – Asia Fundamental Forecast | 10 November 2025 first appeared on IC Markets | Official Blog.
Monday 10th November 2025: Asian Markets Rise as Traders Cheer Prospects of U.S. Government Funding Deal
423299 November 10, 2025 15:40 ICMarkets Market News
Global Markets:
- Asian Stock Markets : Nikkei up 0.93%, Shanghai Composite down -0.03%, Hang Seng up 0.47% ASX up 0.62%
- Commodities : Gold at $4,059.90 (1.26%), Silver at $49.165 (2.13%), Brent Oil at $64.06 (0.68%), WTI Oil at $60.21 (0.68%)
- Rates : US 10-year yield at 4.134, UK 10-year yield at 4.4680, Germany 10-year yield at 2.6676
News & Data:
- (CAD) Employment Change 66.6k to -5.0K expected
- (CAD) Unemployment Rate 6.9% to 7.1% expected
Markets Update:
Asian stock markets are trading mostly higher on Monday, tracking the mixed cues from Wall Street on Friday, as traders welcome reports that the U.S. Senate is nearing a deal to extend government funding after a record 40-day shutdown. Regional currencies also strengthened against the U.S. dollar. Asian markets closed mostly lower on Friday.
In Australia, the S&P/ASX 200 Index is up 0.64 percent to 8,826.00, led by gains in mining and technology stocks. Mineral Resources is soaring nearly 6 percent, while tech names such as Block, Zip, and WiseTech Global are rallying over 4 percent each. Gold miners are also strong, with Evolution Mining and Northern Star up more than 3 percent. Monadelphous Group and DroneShield are both surging about 9 percent on upbeat revenue forecasts and new U.S. contracts.
Japan’s Nikkei 225 Index is also sharply higher, rising 0.98 percent to 50,766.89 amid gains in financial and tech stocks. Advantest and Tokyo Electron are up around 3 percent each, while Mercari and Olympus are soaring over 10 percent.
Elsewhere, South Korea is up nearly 3 percent, and Hong Kong, Malaysia, Indonesia, and Taiwan are higher, while Singapore is slightly lower.
On Wall Street, stocks ended mixed Friday after a volatile session, with the Dow and S&P 500 posting modest gains, while the Nasdaq slipped 0.2 percent.
Upcoming Events:
- 09:30 AM GMT – EUR Sentix Investor Confidence
The post Monday 10th November 2025: Asian Markets Rise as Traders Cheer Prospects of U.S. Government Funding Deal first appeared on IC Markets | Official Blog.
Monday 10th November 2025: Technical Outlook and Review
423285 November 10, 2025 15:39 ICMarkets Market News
DXY (U.S. Dollar Index):
Potential Direction: Bullish
Overall momentum of the chart: Bearish
The price could make a short-term pullback toward the pivot before rising again toward the 1st resistance
Pivot: 98.59
Supporting reasons: Identified as an overlap support, where renewed buying pressure could emerge to push the price higher.
1st support: 96.64
Supporting reasons: Identified as a swing low support, indicating a potential area where the price could again stabilize.
1st resistance: 101.83
Supporting reasons: Identified as an overlap resistance that aligns closely with the 38.2% Fibonacci retracement and the 100% Fibonacci projection, indicating a potential area that could halt any further upward movement
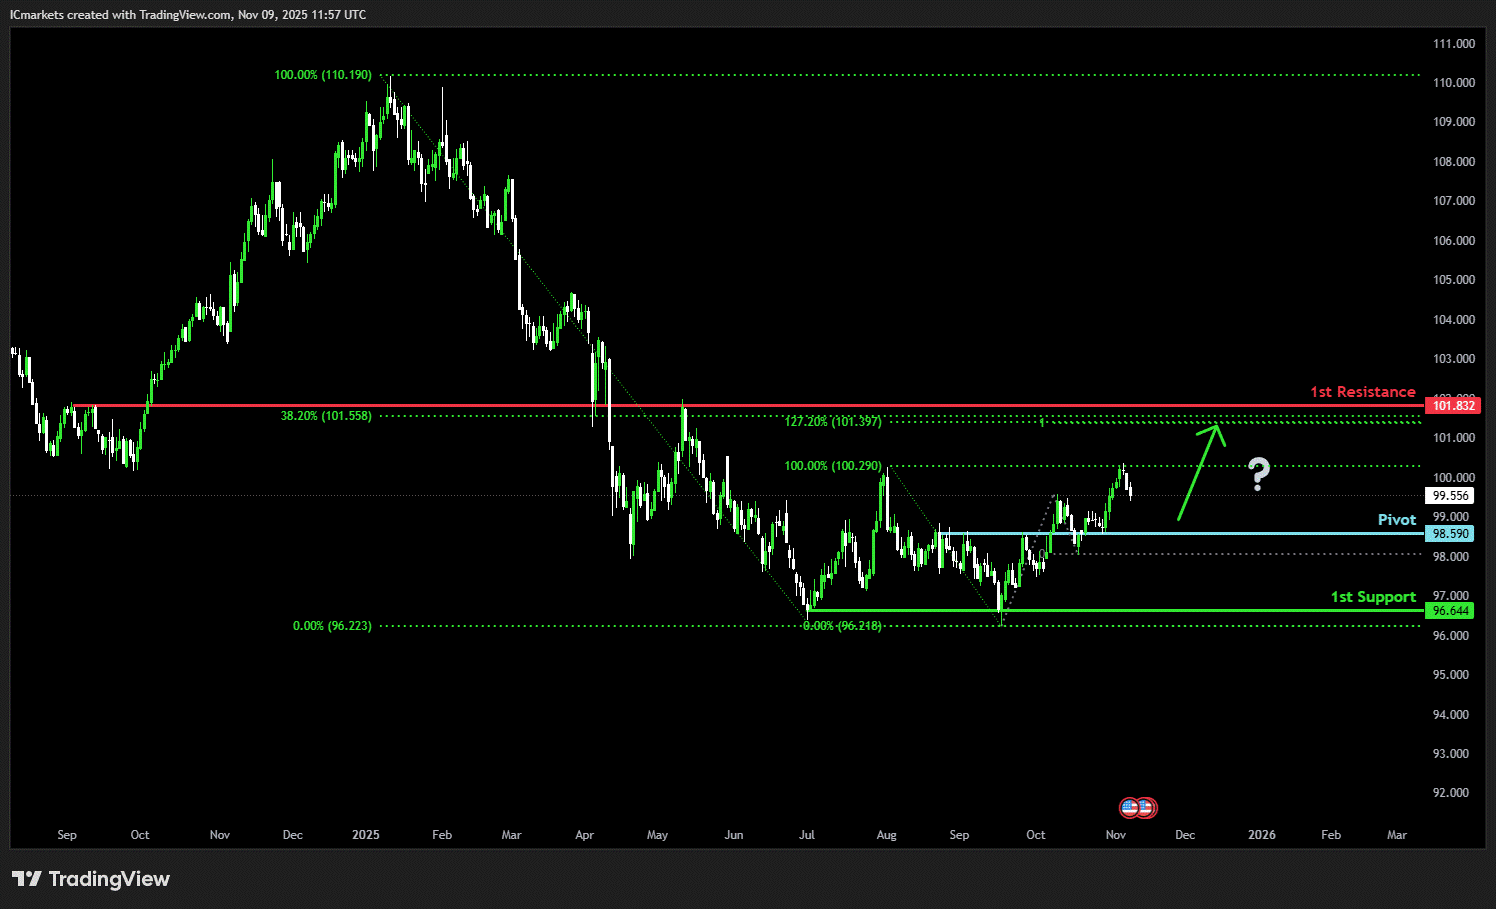
EUR/USD:
Potential Direction: Bearish
Overall momentum of the chart: Bullish
The price has already reacted off the pivot and may continue its bearish move toward the 1st support
Pivot: 1.1596
Supporting reasons: Identified as an overlap resistance, where selling pressures could intensify and potentially cap any upward retracement
1st support: 1.1192
Supporting reasons: Identified as a pullback support that aligns with the 127.2% Fibonacci projection and the 38.2% Fibonacci retracement, indicating a potential level where the price could stabilize once again.
1st resistance: 1.1920
Supporting reasons: Identified as a swing high resistance, indicating a potential level that could cap further upward movement.
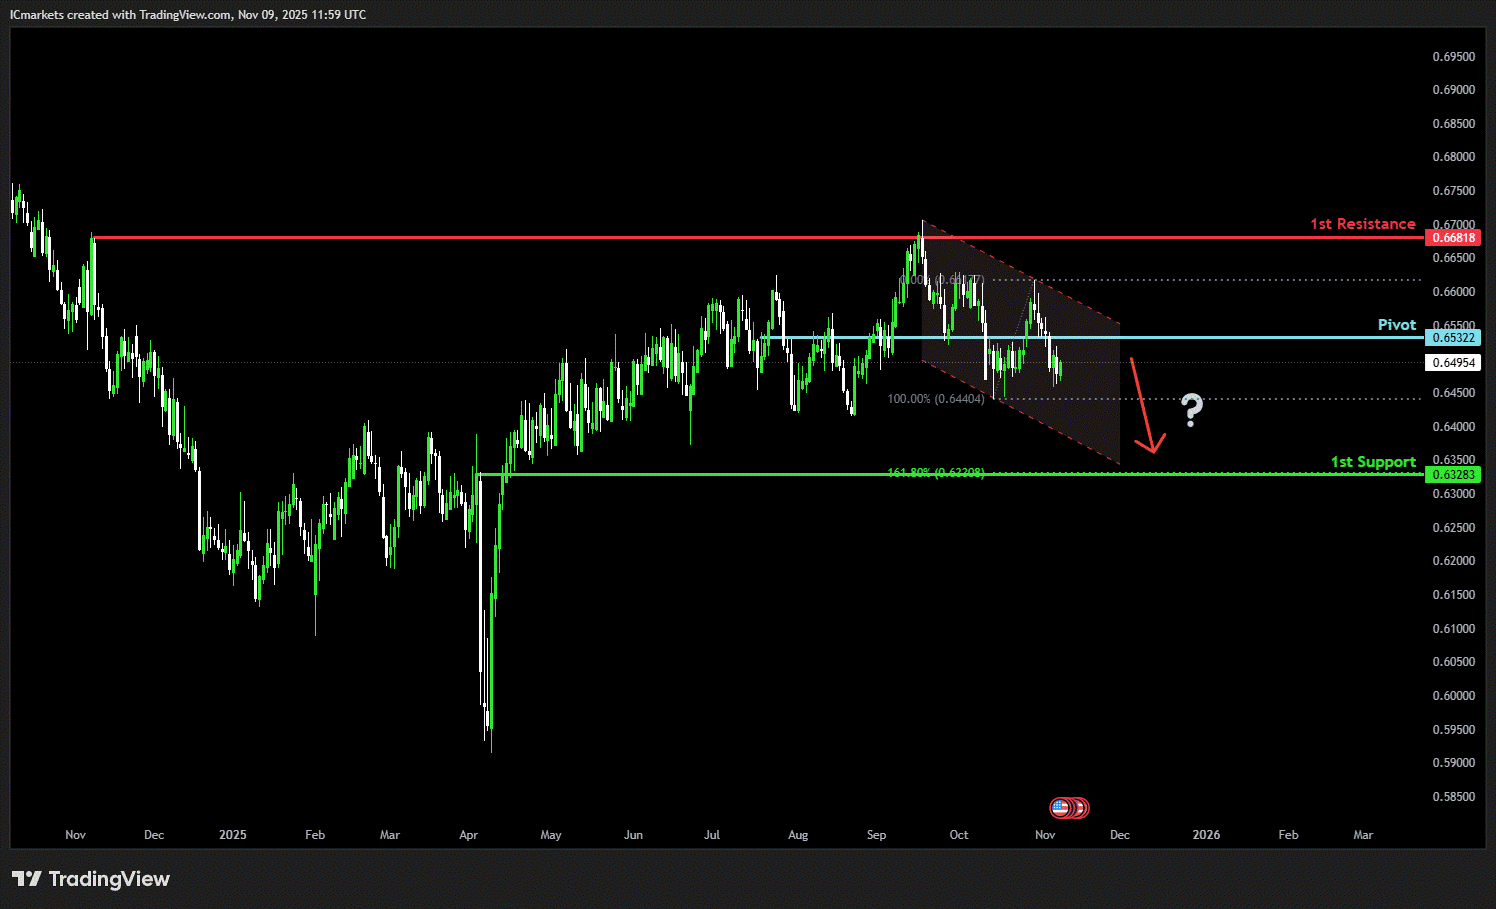
EUR/JPY:
Potential Direction: Bullish
Overall momentum of the chart: Bullish
The price has already bounced off the pivot and may continue its bullish move toward the 1st resistance
Pivot: 175.06
Supporting reasons: Identified as an overlap support, where renewed buying pressure could emerge to push the price higher.
1st support: 170.43
Supporting reasons: Identified as an overlap support, indicating a potential area where the price could again stabilize.
1st resistance: 179.83
Supporting reasons: Identified as a resistance that is supported by the 161.8% Fibonacci extension, indicating a potential level that could cap further upward movement.
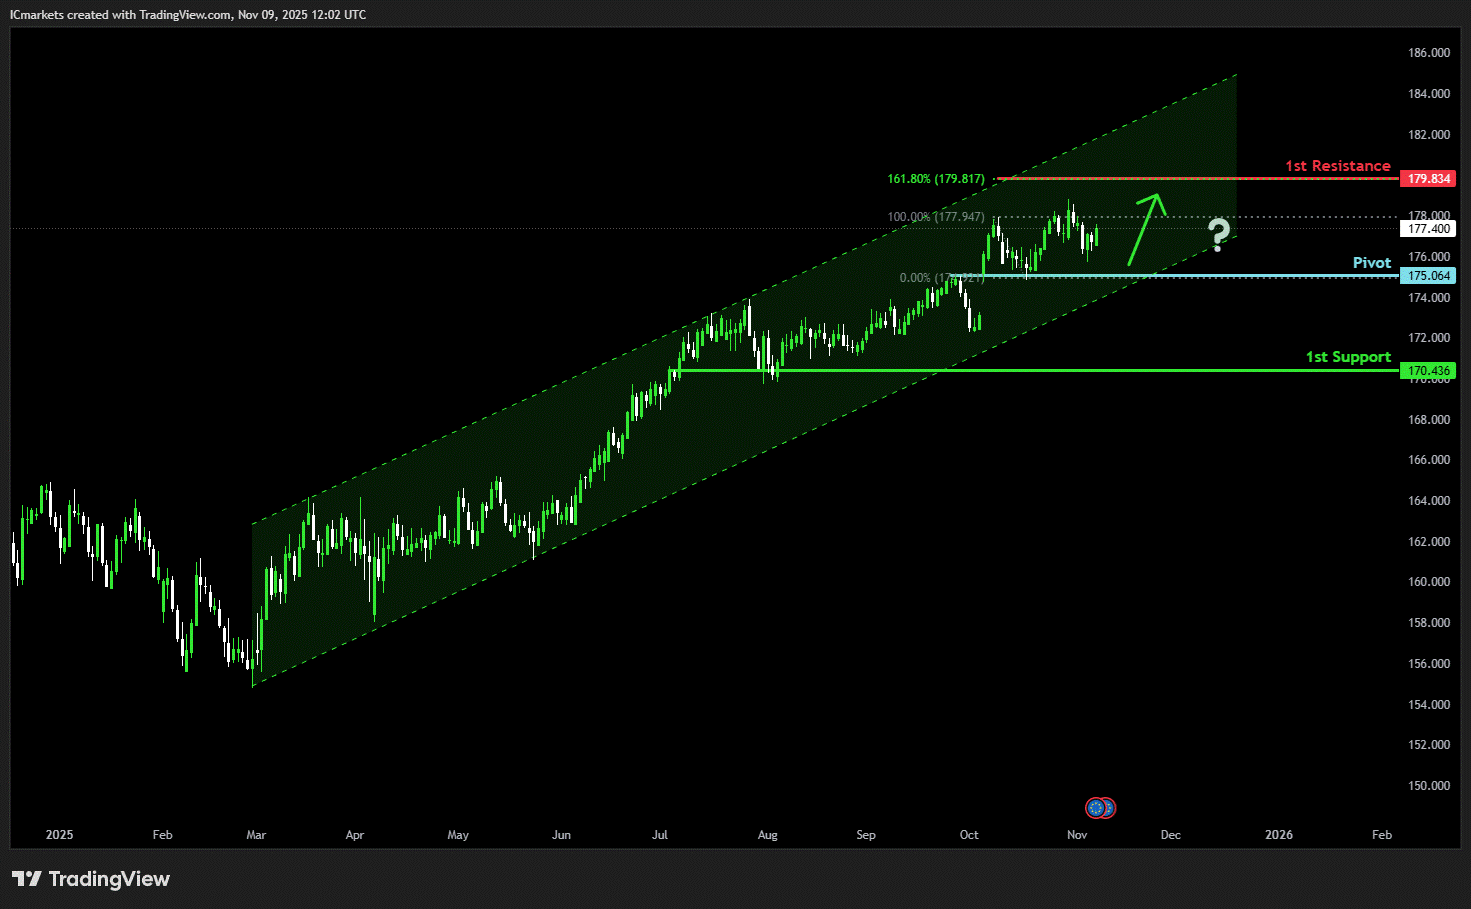
EUR/GBP:
Potential Direction: Bullish
Overall momentum of the chart: Bullish
The price could make a short-term pullback toward the pivot before rising again toward the 1st resistance
Pivot: 0.8744
Supporting reasons: Identified as a pullback support, where renewed buying pressure could emerge to push the price higher.
1st support: 0.8607
Supporting reasons: Identified as an overlap support, indicating a potential area where the price could stabilize once more.
1st resistance: 0.8976
Supporting reasons: Identified as a resistance that is supported by the 161.8% Fibonacci extension, indicating a potential level that could cap further upward movement.
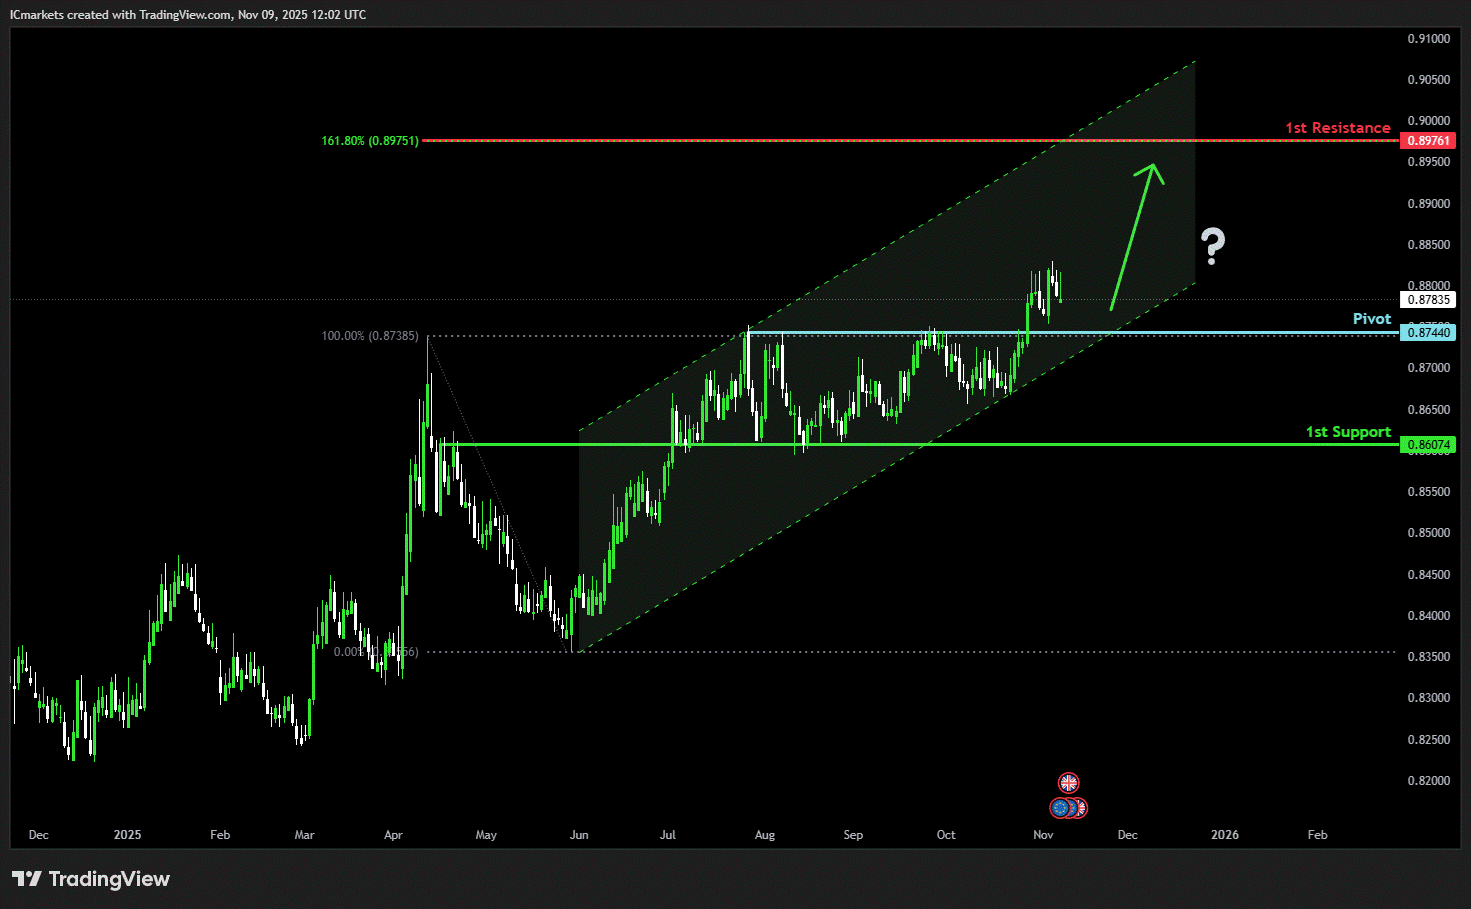
GBP/USD:
Potential Direction: Bearish
Overall momentum of the chart: Bullish
The price could see a short-term pullback toward the pivot before continuing its bearish move down toward the 1st support.
Pivot: 1.3296
Supporting reasons: Identified as a pullback resistance, where selling pressures could intensify and potentially cap any upward retracement.
1st support: 1.3002
Supporting reasons: Identified as a pullback support that aligns with the 100% Fibonacci projection, indicating a potential area where the price could stabilize once more.
1st resistance: 1.3740
Supporting reasons: Identified as a swing high resistance, indicating a potential level that could halt further upward movement.
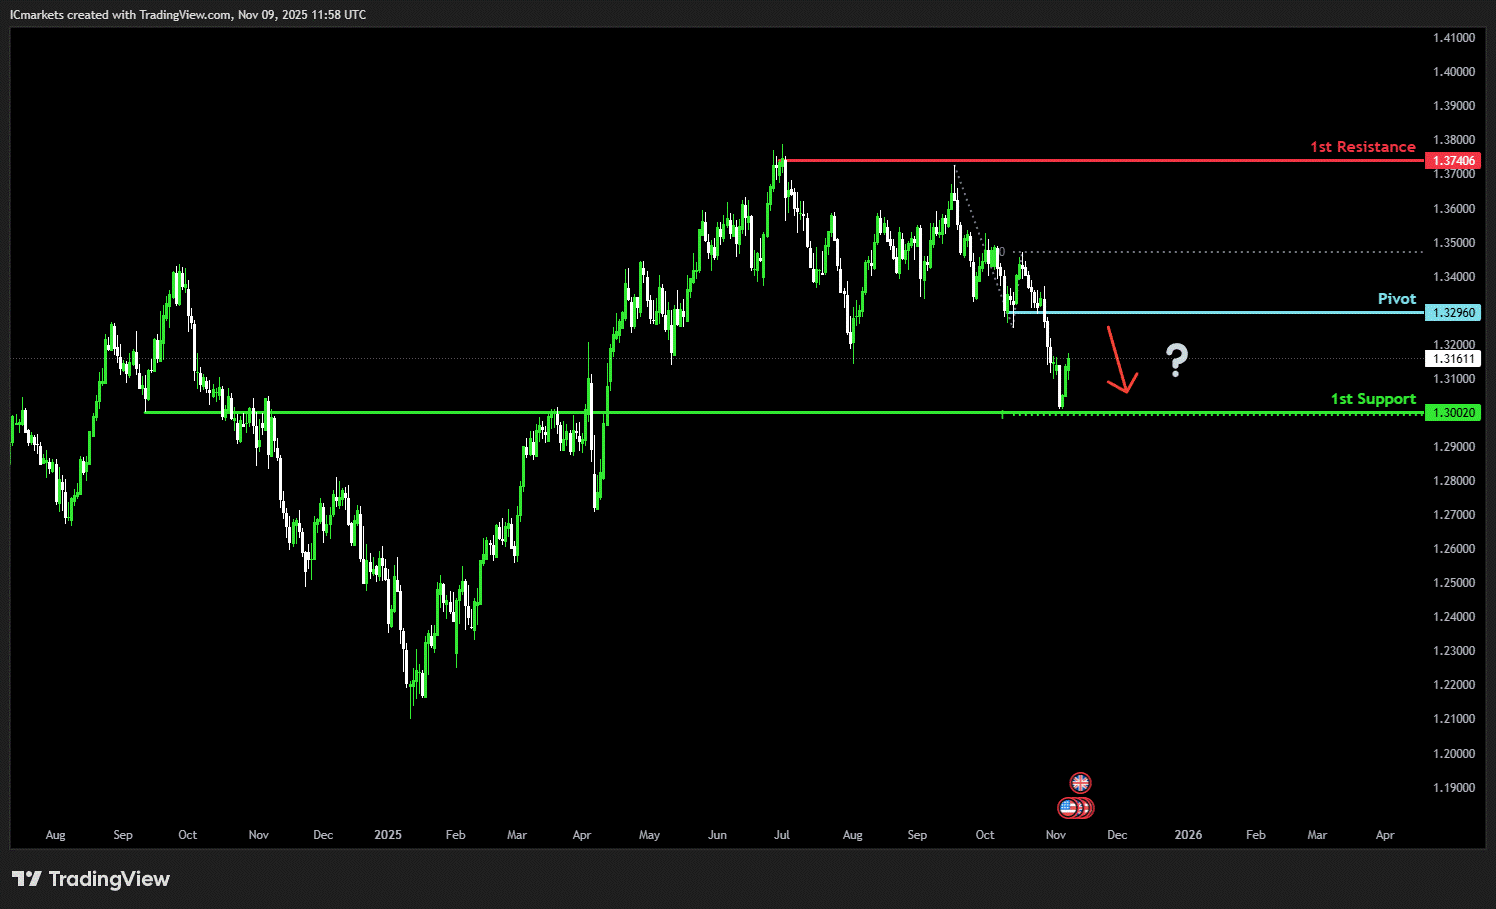
GBP/JPY:
Potential Direction: Bullish
Overall momentum of the chart: Bullish
The price could make a short-term pullback toward the pivot before rising again toward the 1st resistance
Pivot: 199.59
Supporting reasons: Identified as a pullback support, where renewed buying pressure could emerge to push the price higher.
1st support: 195.51
Supporting reasons: Identified as an overlap support, indicating a potential level where the price could stabilize once more.
1st resistance: 205.33
Supporting reasons: Identified as an overlap resistance, indicating a potential level that could halt further upward movement.
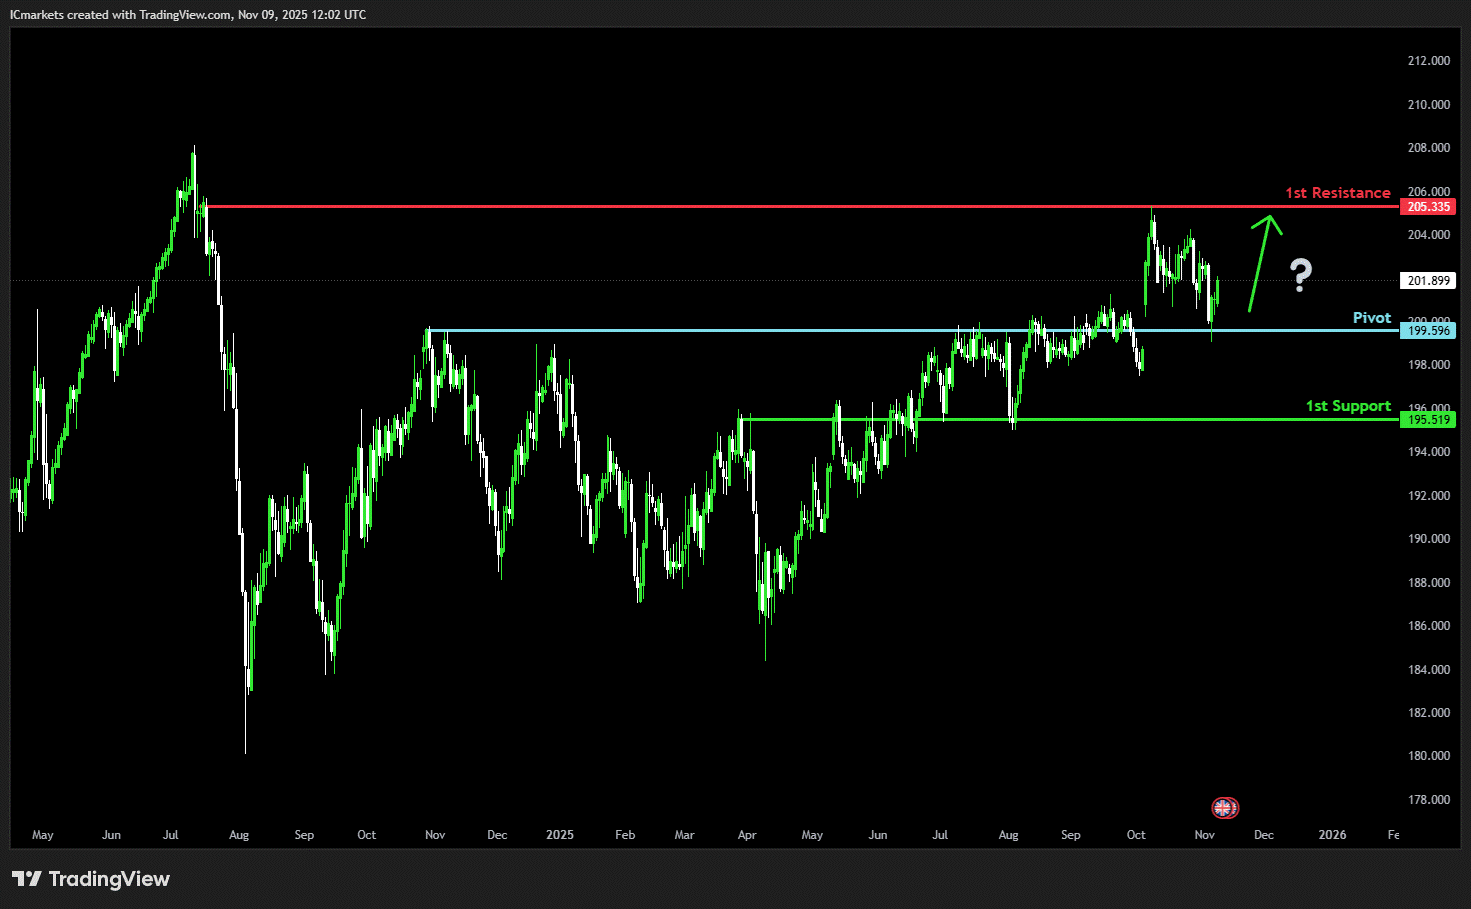
USD/CHF:
Potential Direction: Bullish
Overall momentum of the chart: Bearish
The price could make a short-term pullback toward the pivot before rising again toward the 1st resistance
Pivot: 0.7986
Supporting reasons: Identified as a pullback support, where renewed buying pressure could emerge to push the price higher.
1st support: 0.7872
Supporting reasons: Identified as a swing low support, indicating a potential level where the price could stabilize once again.
1st resistance: 0.8197
Supporting reasons: Identified as an overlap resistance that aligns with the 161.8% Fibonacci extension, indicating a potential level that could cap further upward movement.
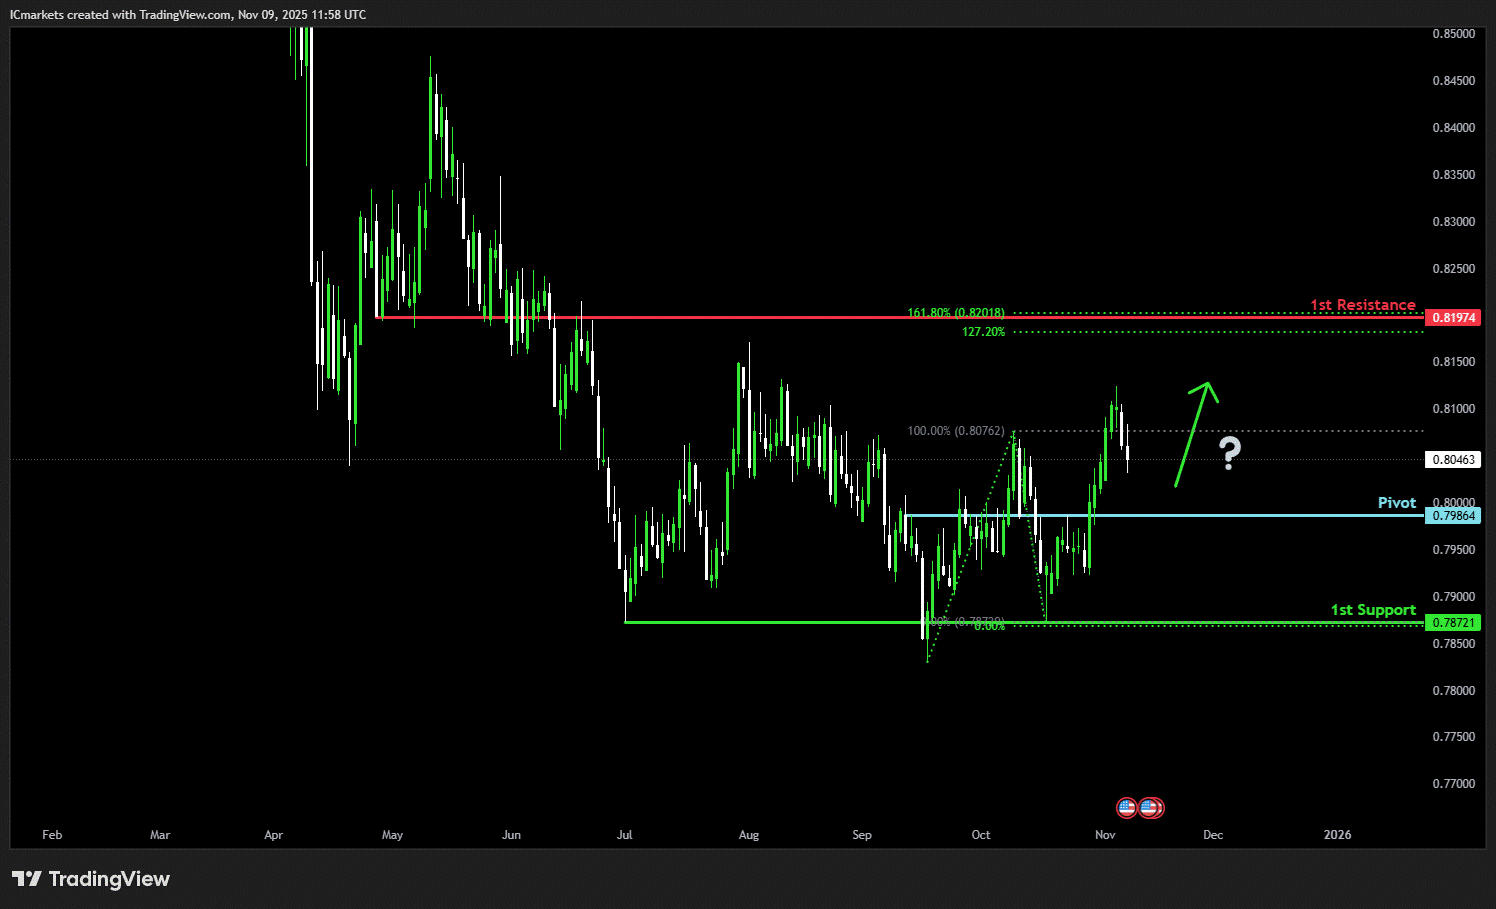
USD/JPY:
Potential Direction: Bullish
Overall momentum of the chart: Bullish
The price could make a short-term pullback toward the pivot before rising again toward the 1st resistance
Pivot: 151.18
Supporting reasons: Identified as a pullback support, where renewed buying pressure could emerge to push the price higher.
1st support: 148.83
Supporting reasons: Identified as a pullback support, indicating a strong area where buyers might return, and the price could stabilize once again.
1st resistance: 156.25
Supporting reasons: Identified as an overlap resistance that aligns with the 161.8% Fibonacci extension. This level represents the next key area where upward movement could be capped amid increased selling pressure
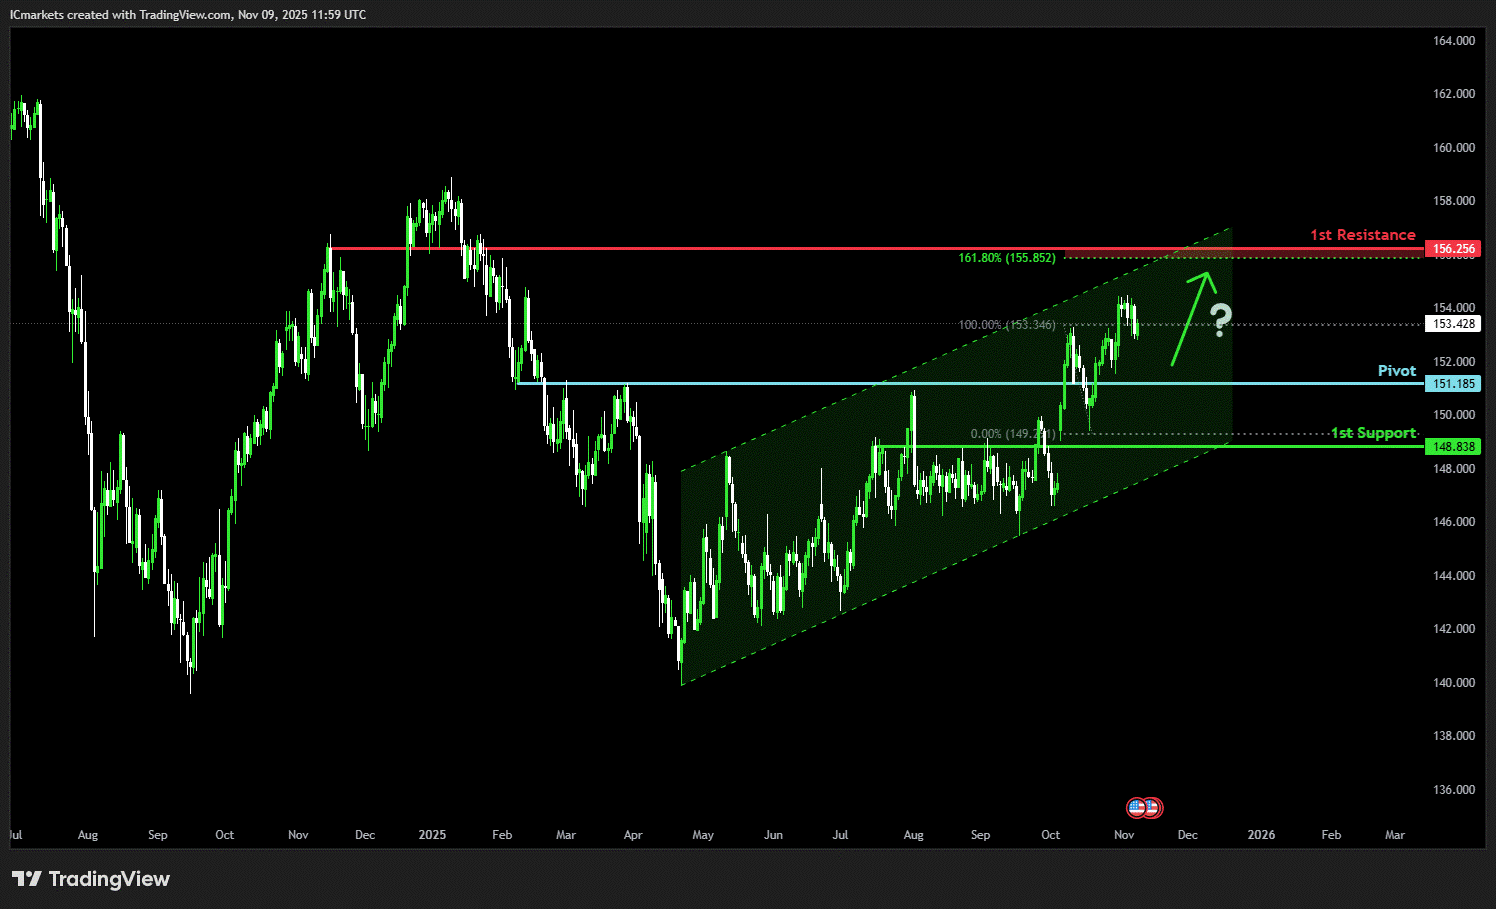
USD/CAD:
Potential Direction: Bullish
Overall momentum of the chart: Bearish
The price could make a short-term pullback toward the pivot before rising again toward the 1st resistance
Pivot: 1.3912
Supporting reasons: Identified as a pullback support, where renewed buying pressure could emerge to push the price higher.
1st support: 1.3761
Supporting reasons: Identified as an overlap support, indicating a key level where the price could stabilize once more.
1st resistance: 1.4151
Supporting reasons: Identified as a pullback resistance that aligns with the 61.8% Fibonacci retracement, making it a possible target for bullish advances and a level where some sellers could return to cap gains
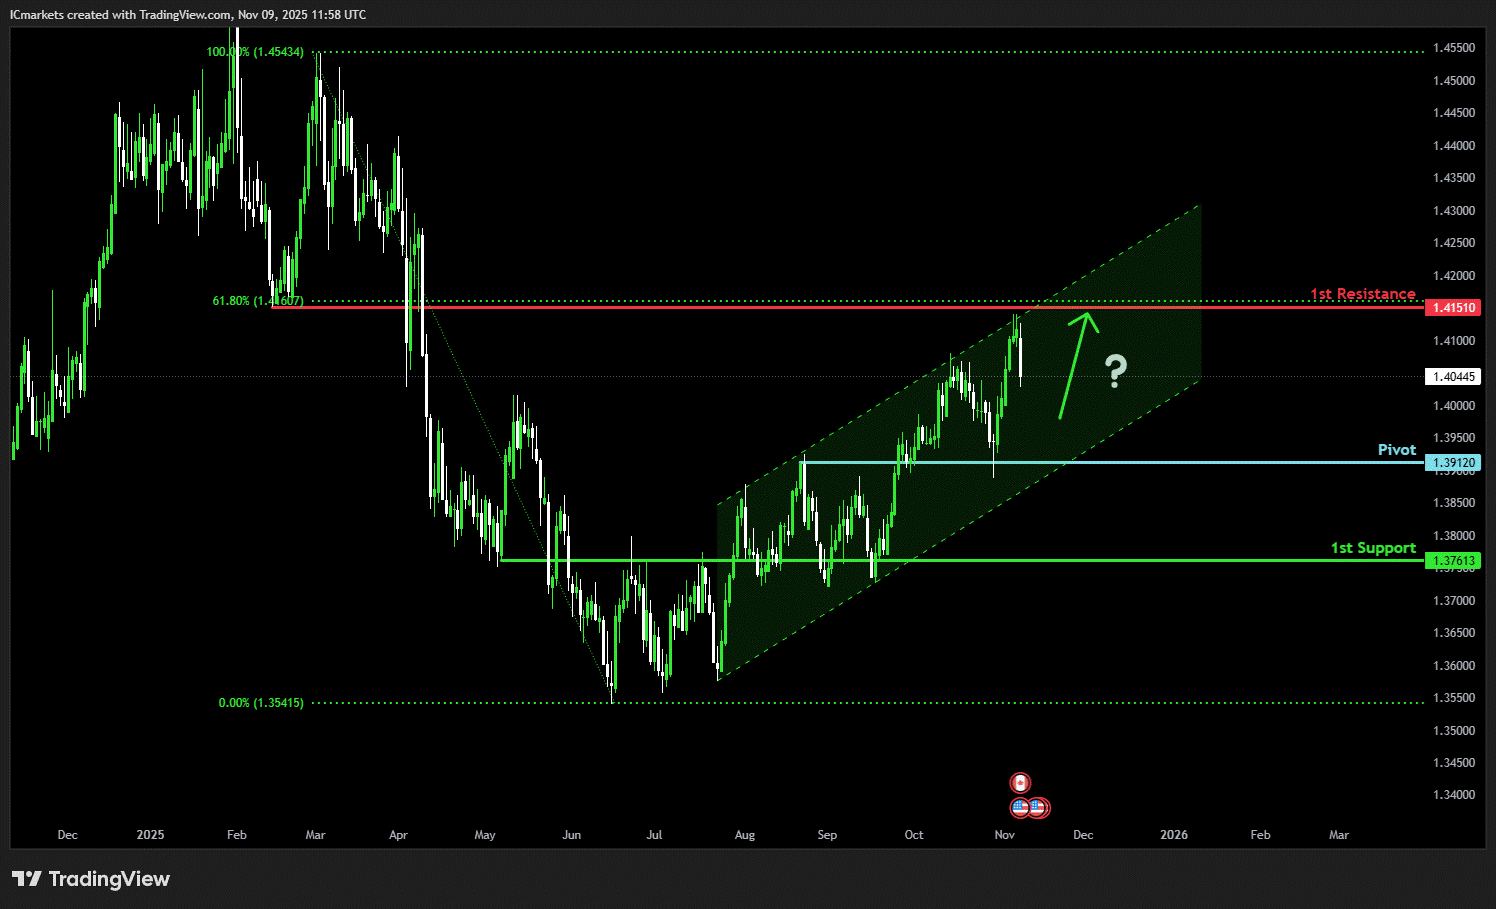
AUD/USD:
Potential Direction: Bearish
Overall momentum of the chart: Bullish
The price could trigger a bearish breakout of the pivot before continuing its bearish move down toward the 1st support.
Pivot: 0.6532
Supporting reasons: Identified as a pullback resistance, where selling pressures could intensify and potentially cap any upward retracement.
1st support: 0.6328
Supporting reasons: Identified as a pullback support that aligns with the 161.8% Fibonacci extension, this area has provided strong support historically and may attract buying interest for a potential short-term bounce
1st resistance: 0.6681
Supporting reasons: Identified as a swing high resistance, indicating a potential area that could halt any further upward movement.
NZD/USD
Potential Direction: Bearish
Overall momentum of the chart: Bearish
The price could see a short-term pullback toward the pivot before continuing its bearish move down toward the 1st support.
Pivot: 0.5705
Supporting reasons: Identified as a pullback resistance, where selling pressures could intensify and potentially cap any upward retracement.
1st support: 0.5542
Supporting reasons: Identified as a swing low support that aligns with the 161.8% Fibonacci projection, this area has provided strong support historically and may attract buying interest for a potential short-term bounce
1st resistance: 0.5847
Supporting reasons: Identified as an overlap resistance, indicating a potential area that could halt any further upward movement.
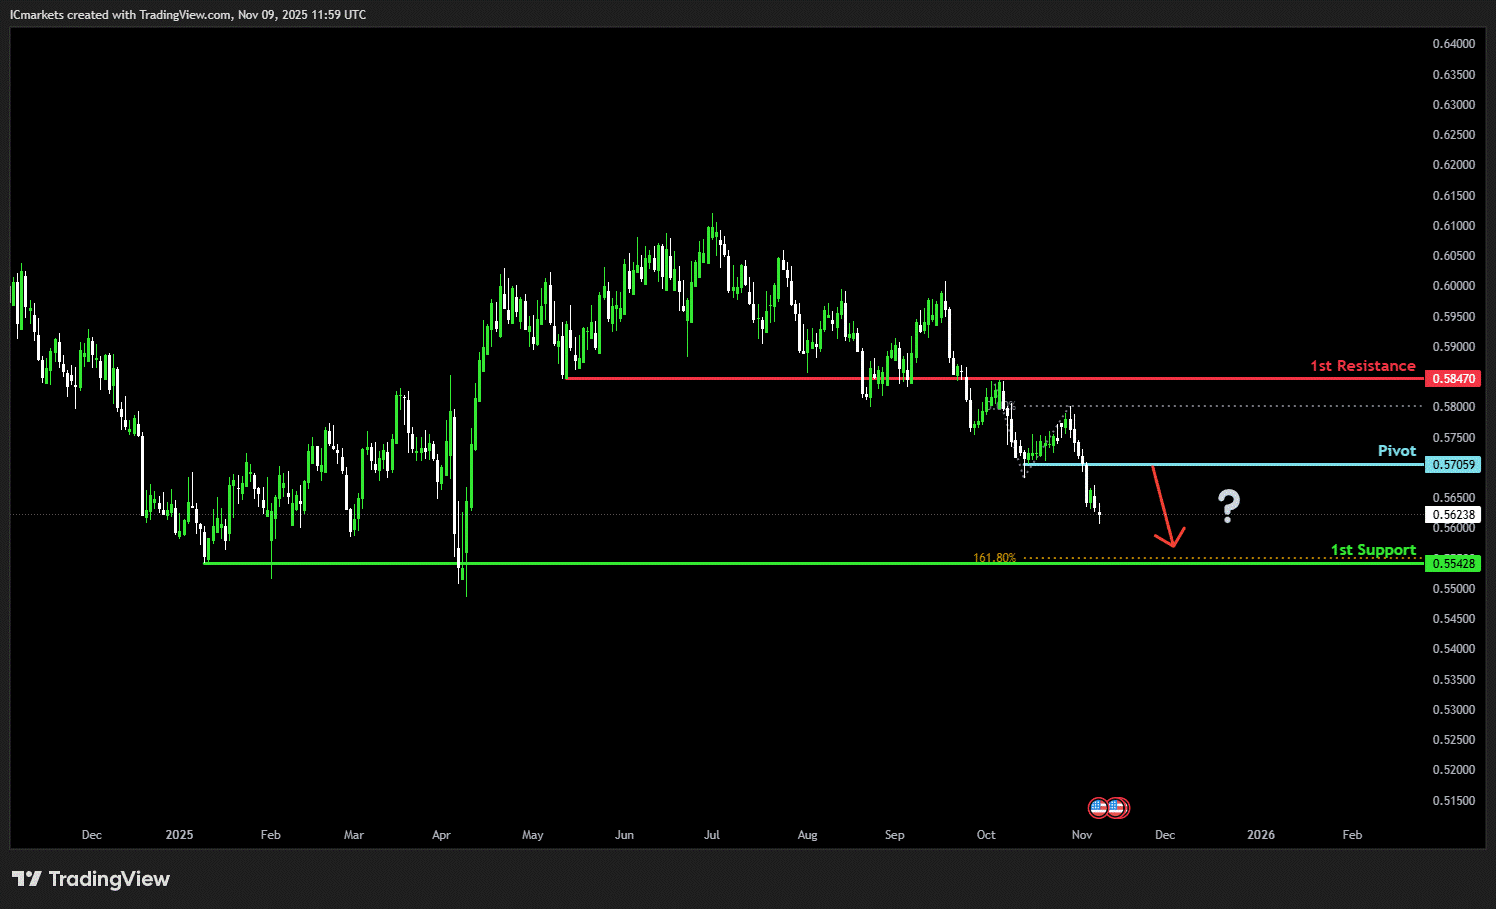
US30 (DJIA):
Potential Direction: Bullish
Overall momentum of the chart: Bullish
The price could make a short-term pullback toward the pivot before rising again toward the 1st resistance
Pivot: 46,841.88
Supporting reasons: Identified as a pullback support, where renewed buying pressure could emerge to push the price higher.
1st support: 45,103.25
Supporting reasons: Identified as an overlap support, suggesting a potential area where the price could stabilize once again.
1st resistance: 50,240.06
Supporting reasons: Identified as a resistance that is supported by the 161.8% Fibonacci extension, indicating a potential area that could halt any further upward movement.
DE40 (DAX):
Potential Direction: Bullish
Overall momentum of the chart: Bullish
The price has already reacted off the pivot and may continue its bearish move toward the 1st support
Pivot: 23,712.00
Supporting reasons: Identified as an overlap resistance, that aligns with the 61.8% Fibonacci retracement where selling pressures could intensify and potentially cap any upward retracement
1st support: 23,145.40
Supporting reasons: Identified as an overlap support, indicating a key level where the price could stabilize once more.
1st resistance: 24,624.84
Supporting reasons: Identified as a swing high resistance, indicating a potential area that could halt any further upward movement.
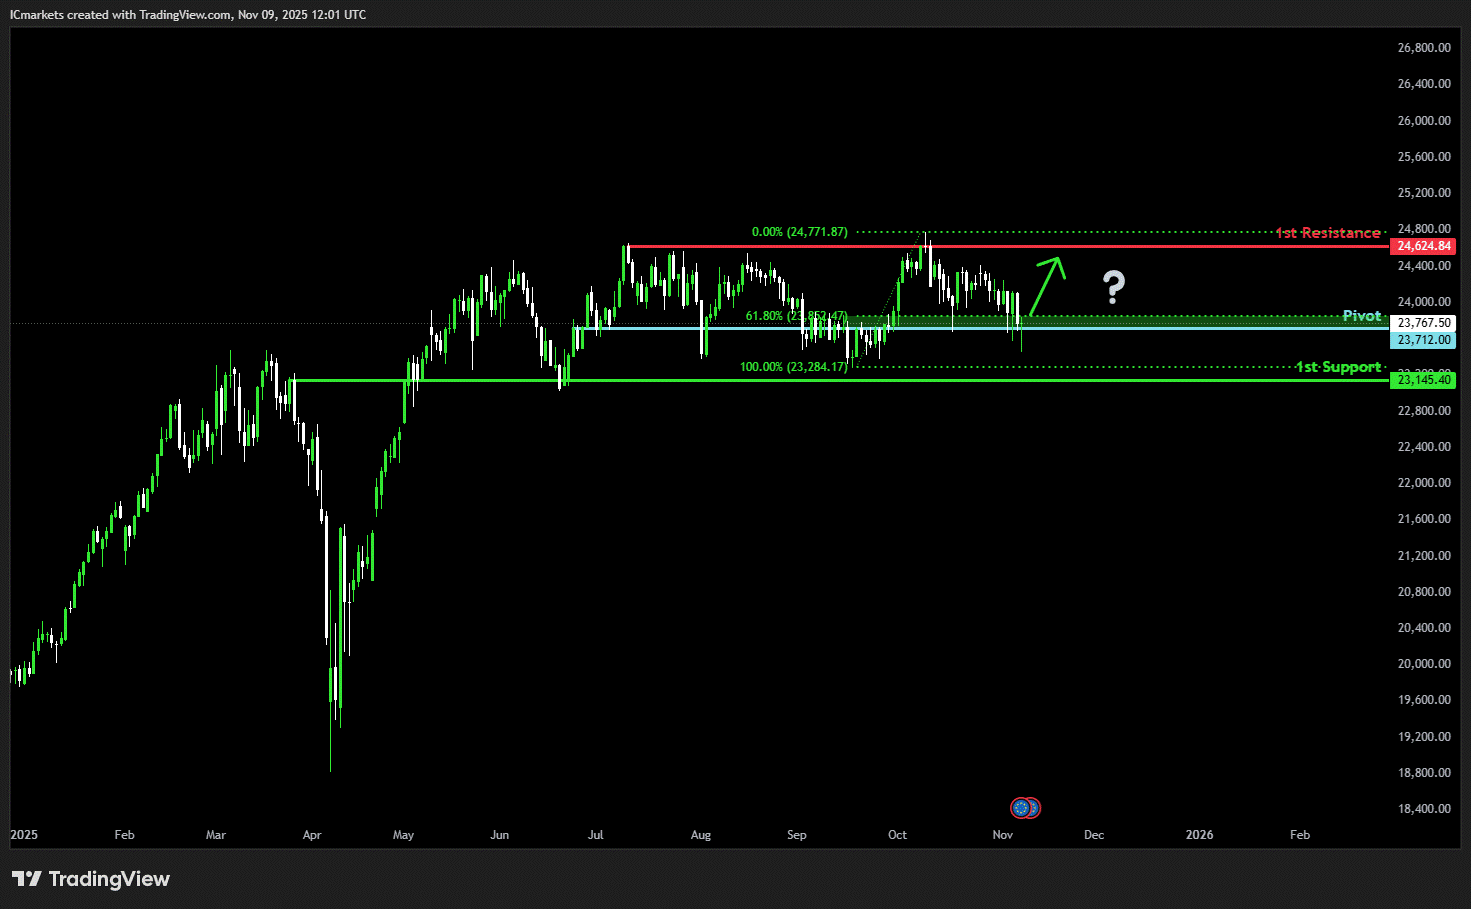
US500 (S&P 500):
Potential Direction: Bullish
Overall momentum of the chart: Bullish
The price could make a short-term pullback toward the pivot before rising again toward the 1st resistance
Pivot: 6,505.98
Supporting reasons: Identified as an overlap support, where renewed buying pressure could emerge to push the price higher.
1st support: 6,141.15
Supporting reasons: Identified as a pullback support, indicating a potential level where the price could stabilize once again.
1st resistance: 6,978.39
Supporting reasons: Identified as a resistance that is supported by the 161.8% Fibonacci extension, indicating a potential area that could halt any further upward movement.
BTC/USD (Bitcoin):
Potential Direction: Bearish
Overall momentum of the chart: Bullish
The price could see a short-term pullback toward the pivot before continuing its bearish move down toward the 1st support.
Pivot: 107,258.25
Supporting reasons: Identified as a pullback resistance, where selling pressures could intensify and potentially cap any upward retracement.
1st support: 92,107.06
Supporting reasons: Identified as an overlap support that aligns with the 61.8% Fibonacci retracement and the 100% Fibonacci projection, indicating a potential level where the price could stabilize once more.
1st resistance: 117,044.00
Supporting reasons: Identified as an overlap resistance, indicating a potential area that could halt any further upward movement.
ETH/USD (Ethereum):
Potential Direction: Bearish
Overall momentum of the chart: Bullish
The price could see a short-term pullback toward the pivot before continuing its bearish move down toward the 1st support.
Pivot: 3,694.00
Supporting reasons: Identified as a pullback resistance, where selling pressures could intensify and potentially cap any upward retracement.
1st support: 2,830.12
Supporting reasons: Identified as a pullback support that aligns with the 61.8% Fibonacci retracement and the 127.2% Fibonacci extension, indicating a potential level where the price could stabilize once more.
1st resistance: 4,267.40
Supporting reasons: Identified as an overlap resistance, indicating a potential area that could halt any further upward movement.
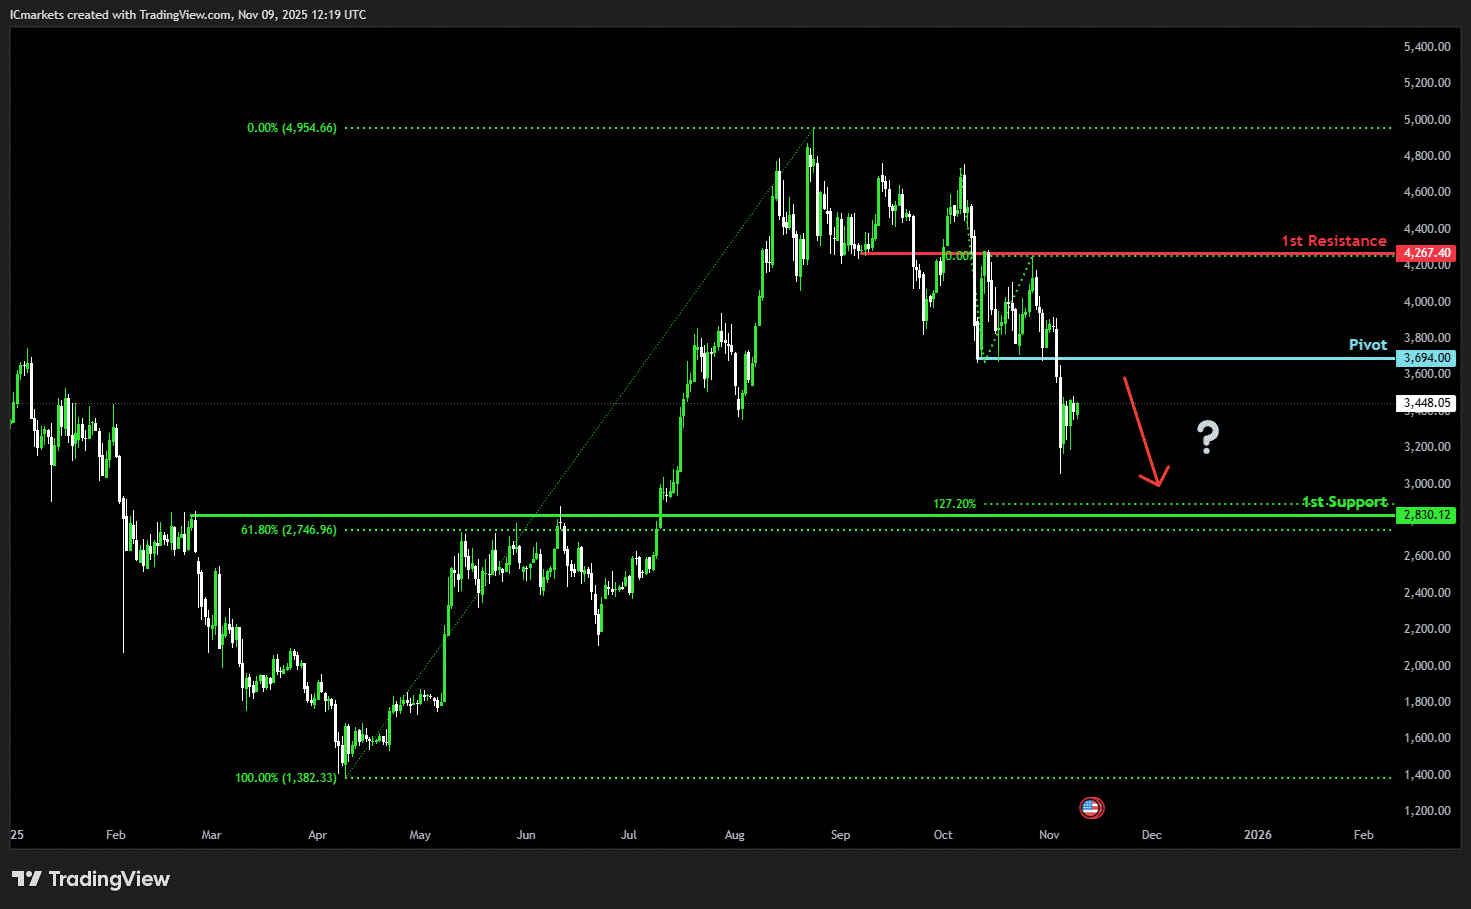
WTI/USD (Oil):
Potential Direction: Bullish
Overall momentum of the chart: Bullish
The price could make a short-term pullback toward the pivot before rising again toward the 1st resistance
Pivot: 57.92
Supporting reasons: Identified as a pullback support, where renewed buying pressure could emerge to push the price higher.
1st support: 54.92
Supporting reasons: Identified as a swing low support, indicating a key level where the price could stabilize once more.
1st resistance: 65.95
Supporting reasons: Identified as an overlap resistance that aligns with the 61.8% Fibonacci retracement, indicating a potential area that could halt any further upward movement.
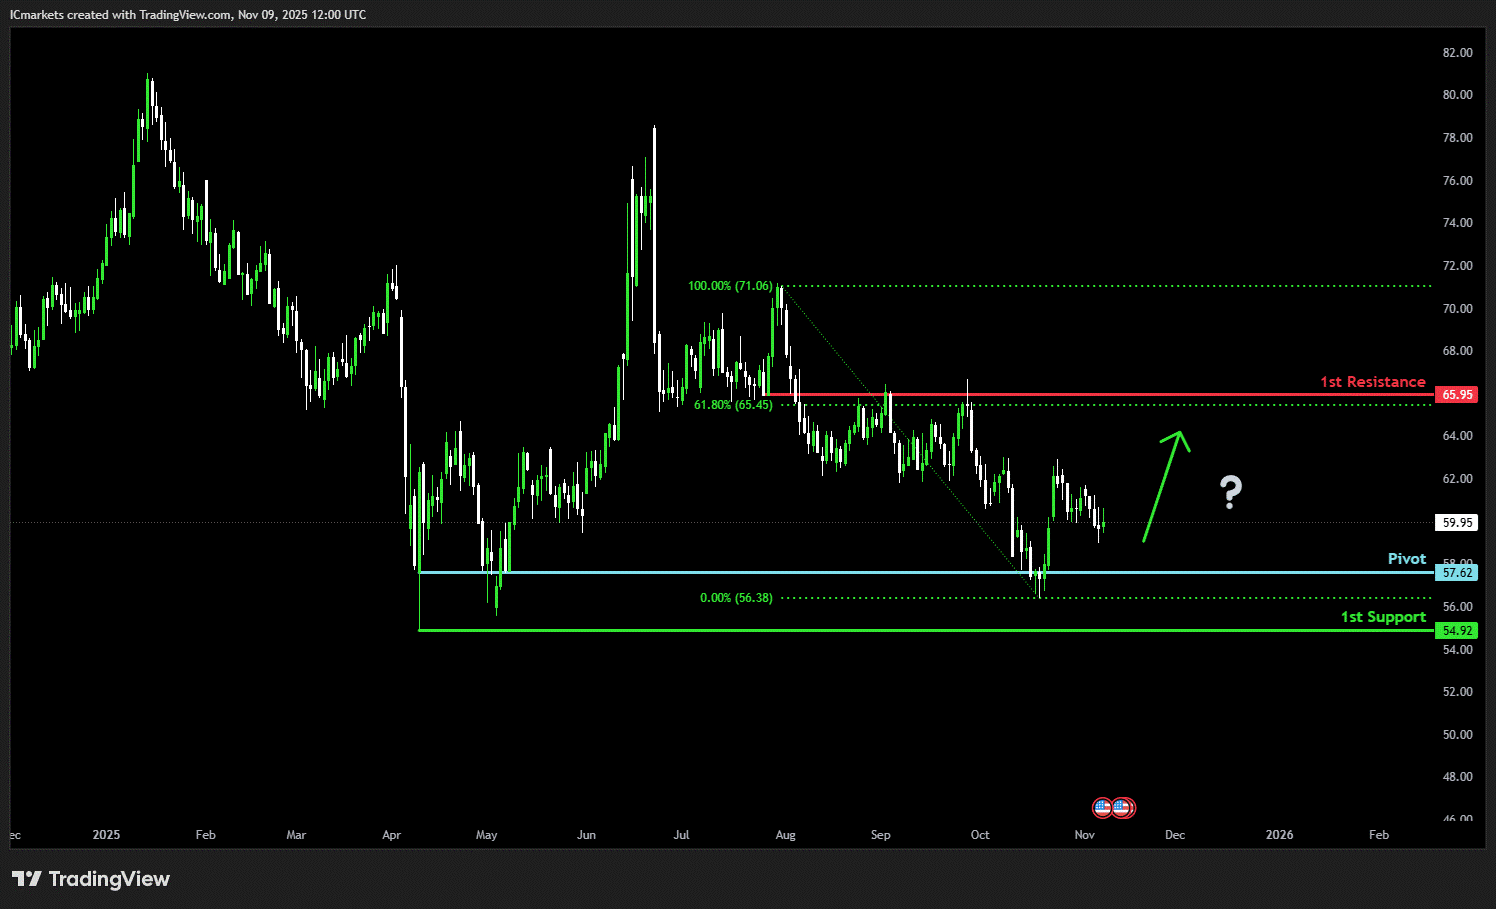
XAU/USD (GOLD):
Potential Direction: Bearish
Overall momentum of the chart: Bullish
The price could see a short-term pullback toward the pivot before continuing its bearish move down toward the 1st support.
Pivot: 4,059.16
Supporting reasons: Identified as a pullback resistance that aligns closely with the 38.2% Fibonacci retracement, where selling pressures could intensify and potentially cap any upward retracement.
1st support: 3,707.52
Supporting reasons: Identified as a pullback support that aligns closely with the 61.8% Fibonacci retracement, indicating a key level where the price could stabilize once more.
1st resistance: 4,379.38
Supporting reasons: Identified as a swing resistance, indicating a potential area that could halt any further upward movement.
The accuracy, completeness and timeliness of the information contained on this site cannot be guaranteed. IC Markets does not warranty, guarantee or make any representations, or assume any liability regarding financial results based on the use of the information in the site.
News, views, opinions, recommendations and other information obtained from sources outside of www.icmarkets.com, used in this site are believed to be reliable, but we cannot guarantee their accuracy or completeness. All such information is subject to change at any time without notice. IC Markets assumes no responsibility for the content of any linked site.
The fact that such links may exist does not indicate approval or endorsement of any material contained on any linked site. IC Markets is not liable for any harm caused by the transmission, through accessing the services or information on this site, of a computer virus, or other computer code or programming device that might be used to access, delete, damage, disable, disrupt or otherwise impede in any manner, the operation of the site or of any user’s software, hardware, data or property.
The post Monday 10th November 2025: Technical Outlook and Review first appeared on IC Markets | Official Blog.