Articles
Tuesday 16th December 2025: Technical Outlook and Review
424573 December 16, 2025 15:14 ICMarkets Market News
DXY (U.S. Dollar Index):
Potential Direction: Bearish
Overall momentum of the chart: Bearish
The price could see a short-term pullback toward the pivot before continuing its bearish move down toward the 1st support.
Pivot: 98.77
Supporting reasons: Identified as a pullback resistance, where selling pressures could intensify and potentially cap any upward retracement.
1st support: 97.97
Supporting reasons: Identified as an overlap support that aligns with the 161.8% Fibonacci extension, indicating a potential area where the price could again stabilize.
1st resistance: 99.06
Supporting reasons: Identified as a pullback resistance, indicating a potential area that could halt any further upward movement
EUR/USD:
Potential Direction: Bullish
Overall momentum of the chart: Bearish
The price could see a short-term pullback toward the pivot before rising again toward the 1st resistance.
Pivot: 1.1710
Supporting reasons: Identified as a pullback support, where renewed buying pressure could emerge to push the price higher.
1st support: 1.1644
Supporting reasons: Identified as a pullback support, indicating a potential level where the price could stabilize once again.
1st resistance: 1.1810
Supporting reasons: Identified as a swing high resistance that aligns closely with the 100% Fibonacci projection, indicating a potential level that could cap further upward movement.

EUR/JPY:
Potential Direction: Bullish
Overall momentum of the chart: Bullish
The price could see a short-term pullback toward the pivot before rising again toward the 1st resistance.
Pivot: 181.69
Supporting reasons: Identified as a pullback support that aligns with the 50% Fibonacci retracement, where renewed buying pressure could emerge to push the price higher.
1st support: 179.92
Supporting reasons: Identified as a pullback support, indicating a potential area where the price could again stabilize.
1st resistance: 183.02
Supporting reasons: Identified as a swing high resistance, indicating a potential level that could cap further upward movement.
EUR/GBP:
Potential Direction: Bullish
Overall momentum of the chart: Bullish
The price could see a short-term pullback toward the pivot before rising again toward the 1st resistance.
Pivot: 0.8749
Supporting reasons: Identified as a pullback support, where renewed buying pressure could emerge to push the price higher.
1st support: 0.8722
Supporting reasons: Identified as a multi-swing low support, indicating a potential area where the price could stabilize once more.
1st resistance: 0.8799
Supporting reasons: Identified as an overlap resistance, indicating a potential level that could cap further upward movement.

GBP/USD:
Potential Direction: Bullish
Overall momentum of the chart: Bullish
The price could see a short-term pullback toward the pivot before rising again toward the 1st resistance.
Pivot: 1.3353
Supporting reasons: Identified as a pullback support, where renewed buying pressure could emerge to push the price higher.
1st support: 1.3287
Supporting reasons: Identified as an overlap support, indicating a potential area where the price could stabilize once more.
1st resistance: 1.3452
Supporting reasons: Identified as a swing high resistance, indicating a potential level that could halt further upward movement.
GBP/JPY:
Potential Direction: Bullish
Overall momentum of the chart: Bullish
The price could see a short-term pullback toward the pivot before rising again toward the 1st resistance.
Pivot: 207.17
Supporting reasons: Identified as an overlap resistance that aligns with the 50% Fibonacci retracement, where selling pressures could intensify and potentially cap any upward retracement
1st support: 205.32
Supporting reasons: Identified as an overlap support, indicating a potential level where the price could stabilize once more.
1st resistance: 208.94
Supporting reasons: Identified as a swing high resistance, indicating a potential level that could halt further upward movement.

USD/CHF:
Potential Direction: Bearish
Overall momentum of the chart: Bearish
The price could see a short-term pullback toward the pivot before continuing its bearish move down toward the 1st support.
Pivot: 0.7987
Supporting reasons: Identified as a pullback resistance, where selling pressures could intensify and potentially cap any upward retracement.
1st support: 0.7926
Supporting reasons: Identified as a pullback support that aligns with the 78.6% Fibonacci retracement, indicating a potential level where the price could stabilize once again.
1st resistance: 0.8028
Supporting reasons: Identified as a pullback resistance, indicating a potential level that could cap further upward movement.
USD/JPY:
Potential Direction: Bearish
Overall momentum of the chart: Bullish
The price has already reacted off the pivot and may continue its bearish move toward the 1st support.
Pivot: 155.34
Supporting reasons: Identified as an overlap resistance, where selling pressures could intensify and potentially cap any upward retracement
1st support: 153.26
Supporting reasons: Identified as a swing low support that aligns closely with the 127.2% Fibonacci projection, indicating a strong area where buyers might return, and the price could stabilize once again.
1st resistance: 156.95
Supporting reasons: Identified as a swing high resistance. This level represents the next key area where upward movement could be capped amid increased selling pressure
USD/CAD:
Potential Direction: Bearish
Overall momentum of the chart: Bearish
The price could see a short-term pullback toward the pivot before continuing its bearish move down toward the 1st support.
Pivot: 1.3890
Supporting reasons: Identified as a pullback resistance, where selling pressures could intensify and potentially cap any upward retracement.
1st support: 1.3768
Supporting reasons: Identified as a swing low support, indicating a key level where the price could stabilize once more.
1st resistance: 1.3960
Supporting reasons: Identified as an overlap resistance, making it a possible target for bullish advances and a level where some sellers could return to cap gains
AUD/USD:
Potential Direction: Bullish
Overall momentum of the chart: Bullish
The price could see a short-term pullback toward the pivot before rising again toward the 1st resistance.
Pivot: 0.6622
Supporting reasons: Identified as an overlap support that aligns with the 23.6% Fibonacci retracement, where renewed buying pressure could emerge to push the price higher.
1st support: 0.6572
Supporting reasons: Identified as a pullback support that aligns with the 38.6% Fibonacci retracement, this area has provided strong support historically and may attract buying interest for a potential short-term bounce
1st resistance: 0.6684
Supporting reasons: Identified as an overlap resistance that aligns with the 161.8% Fibonacci extension, indicating a potential area that could halt any further upward movement.
NZD/USD
Potential Direction: Bearish
Overall momentum of the chart: Bullish
The price could see a short-term pullback toward the pivot before continuing its bearish move down toward the 1st support.
Pivot: 0.5796
Supporting reasons: Identified as an overlap resistance, where selling pressures could intensify and potentially cap any upward retracement.
1st support: 0.5743
Supporting reasons: Identified as a pullback support that aligns with the 38.2% Fibonacci retracement, this area has provided strong support historically and may attract buying interest for a potential short-term bounce
1st resistance: 0.5831
Supporting reasons: Identified as a swing high resistance, indicating a potential area that could halt any further upward movement.
US30 (DJIA):
Potential Direction: Bullish
Overall momentum of the chart: Bullish
The price could see a short-term pullback toward the pivot before rising again toward the 1st resistance.
Pivot: 48,000
Supporting reasons: Identified as a pullback support that aligns with the 61.8% Fibonacci retracement, where renewed buying pressure could emerge to push the price higher.
1st support: 47,372.40
Supporting reasons: Identified as a pullback support, suggesting a potential area where the price could stabilize once again.
1st resistance: 48,879.50
Supporting reasons: Identified as a swing high resistance, indicating a potential area that could halt any further upward movement.
DE40 (DAX):
Potential Direction: Bullish
Overall momentum of the chart: Bullish
The price could see a short-term pullback toward the pivot before rising again toward the 1st resistance.
Pivot: 23,945.80
Supporting reasons: Identified as a pullback support, where renewed buying pressure could emerge to push the price higher.
1st support: 23,488.00
Supporting reasons: Identified as a pullback support, indicating a key level where the price could stabilize once more.
1st resistance: 24,444.50
Supporting reasons: Identified as a swing high resistance that aligns with the 100% Fibonacci projection, indicating a potential area that could halt any further upward movement.
US500 (S&P 500):
Potential Direction: Bullish
Overall momentum of the chart: Bullish
The price could see a short-term pullback toward the pivot before rising again toward the 1st resistance.
Pivot: 6,773.23
Supporting reasons: Identified as a pullback support that aligns with the 38.2% Fibonacci retracement, where renewed buying pressure could emerge to push the price higher.
1st support: 6,673.25
Supporting reasons: Identified as an overlap support that aligns with the 61.8% Fibonacci retracement, indicating a potential level where the price could stabilize once again.
1st resistance: 6,920.20
Supporting reasons: Identified as a swing high resistance, indicating a potential area that could halt any further upward movement.
BTC/USD (Bitcoin):
Potential Direction: Bearish
Overall momentum of the chart: Bearish
The price could see a short-term pullback toward the pivot before continuing its bearish move down toward the 1st support.
Pivot: 88,893.73
Supporting reasons: Identified as a pullback resistance, where selling pressures could intensify and potentially cap any upward retracement.
1st support: 81604.89
Supporting reasons: Identified as a swing low support, indicating a potential level where the price could stabilize once more.
1st resistance: 94,626.23
Supporting reasons: Identified as an overlap resistance that aligns with the 50% Fibonacci retracement, indicating a potential area that could halt any further upward movement.
ETH/USD (Ethereum):
Potential Direction: Bearish
Overall momentum of the chart: Bullish
The price could see a short-term pullback toward the pivot before continuing its bearish move down toward the 1st support.
Pivot: 3,180.10
Supporting reasons: Identified as an overlap resistance, where selling pressures could intensify and potentially cap any upward retracement.
1st support: 2,904.01
Supporting reasons: Identified as an overlap support that aligns with the 61.8% Fibonacci projection, indicating a potential level where the price could stabilize once more.
1st resistance: 3,404.43
Supporting reasons: Identified as an overlap resistance, indicating a potential area that could halt any further upward movement.
WTI/USD (Oil):
Potential Direction: Bearish
Overall momentum of the chart: Bullish
The price could see a short-term pullback toward the pivot before continuing its bearish move down toward the 1st support.
Pivot: 57,52
Supporting reasons: Identified as a pullback resistance, where selling pressures could intensify and potentially cap any upward retracement.
1st support: 56.38
Supporting reasons: Identified as a swing low support that aligns with the 127.2% Fibonacci extension and the 100% Fibonacci projection, indicating a key level where the price could stabilize once more.
1st resistance: 58.35
Supporting reasons: Identified as a pullback resistance, indicating a potential area that could halt any further upward movement.
XAU/USD (GOLD):
Potential Direction: Bullish
Overall momentum of the chart: Bullish
The price could see a short-term pullback toward the pivot before rising again toward the 1st resistance.
Pivot: 4,255.04
Supporting reasons: Identified as a pullback support, where renewed buying pressure could emerge to push the price higher.
1st support: 4,145.75
Supporting reasons: Identified as a pullback support, indicating a key level where the price could stabilize once more.
1st resistance: 4,366.45
Supporting reasons: Identified as a swing high resistance that aligns with the 161.8% Fibonacci extension, indicating a potential area that could halt any further upward movement.

The accuracy, completeness and timeliness of the information contained on this site cannot be guaranteed. IC Markets Global does not warranty, guarantee or make any representations, or assume any liability regarding financial results based on the use of the information in the site.
News, views, opinions, recommendations and other information obtained from sources outside of www.icmarkets.com, used in this site are believed to be reliable, but we cannot guarantee their accuracy or completeness. All such information is subject to change at any time without notice. IC Markets Global assumes no responsibility for the content of any linked site.
The fact that such links may exist does not indicate approval or endorsement of any material contained on any linked site. IC Markets Global is not liable for any harm caused by the transmission, through accessing the services or information on this site, of a computer virus, or other computer code or programming device that might be used to access, delete, damage, disable, disrupt or otherwise impede in any manner, the operation of the site or of any user’s software, hardware, data or property.
The post Tuesday 16th December 2025: Technical Outlook and Review first appeared on IC Markets | Official Blog.

IC Markets Global – Asia Fundamental Forecast | 16 December 2025
424572 December 16, 2025 15:14 ICMarkets Market News
IC Markets Global – Asia Fundamental Forecast | 16 December 2025
What happened in the U.S. session?
The U.S. session, markets traded in a consolidative, slightly risk‑on tone as investors positioned for a barrage of U.S. macro releases, including delayed jobs data, CPI, and retail sales that will refine expectations for the Fed’s 2026 easing path. U.S. indices saw mixed but generally stabilizing price action, with the S&P 500 and Dow attempting to recover from last week’s tech‑driven rout while the Nasdaq lagged on renewed concerns about AI‑related spending and profitability. U.S. Treasury yields nudged higher, and the curve steepened, supporting a marginally firmer dollar index, even as markets continued to embed additional cuts over the next year.
What does it mean for the Asia Session?
For Asian desks, the focus is on a synchronized run of PMIs from Japan and the eurozone, UK labour statistics, and a delayed US Employment Situation report paired with retail sales that together could reset expectations for global growth and major central‑bank paths. A softer‑than‑expected US jobs print or weak retail numbers would likely reinforce the medium‑term bearish tone in the dollar and favour EUR, GBP, AUD, and gold, while also pressuring risk assets on growth worries, whereas resilient employment and spending could revive USD strength and support equities and oil.
The Dollar Index (DXY)
Key news events today
ADP Weekly Employment Change (Tentative)
Average Hourly Earnings m/m (1:30 pm GMT)
Core Retail Sales m/m (1:30 pm GMT)
Non-Farm Employment Change (1:30 pm GMT)
Retail Sales m/m (1:30 pm GMT)
Unemployment Rate (1:30 pm GMT)
Flash Manufacturing PMI (2:45 pm GMT)
Flash Services PMI (2:45 pm GMT)
What can we expect from DXY today?
The U.S. dollar is trading with a soft, bearish tone today as markets continue to fade last week’s “hawkish” Fed cut and position ahead of a heavy data slate starting with the delayed jobs report on December 16. The Dollar Index has broken key support and remains in a pattern of lower highs and lower lows, reinforcing a medium‑bearish technical backdrop even as it holds slightly above levels seen a few months ago.
Central Bank Notes:
- The Federal Open Market Committee (FOMC) is widely expected to lower the federal funds rate target range by 25 basis points to 3.50%–3.75% at its December 9–10, 2025, meeting, marking the third consecutive cut after the October reduction to 3.75%–4.00%
- The Committee continues to pursue maximum employment and 2% inflation goals, with the labor market showing further softening as the unemployment rate rose to 4.4% in September 2025 amid modest job gains.
- Officials note persistent downside risks to growth alongside resilient activity, with inflation easing to 3.0% year-over-year CPI in September but remaining elevated due to tariff effects; core PCE stands at around 2.8% as of October.
- Economic activity grew at a 3.8% annualized pace in Q2 2025 per revised estimates, though Q3 and Q4 face headwinds from trade tensions, fiscal restraint, and data disruptions like the government shutdown.
- September’s Summary of Economic Projections forecasts 2025 unemployment at a median 4.5%, with PCE inflation near 3.0% and core PCE at 3.1%, signaling a gradual disinflation path; updates expected on December 10 may adjust for higher unemployment and lower growth.
- The Committee maintained its data-dependent approach, noting a softening labor market and inflation above the 2% target, while deciding to lower the federal funds rate target range by 25 basis points to 3.50%-3.75%. Dissent persisted, with multiple members opposing the cut or advocating for a hold, reflecting divisions similar to recent meetings.
- The FOMC confirmed the conclusion of its quantitative tightening program effective December 1, 2025, with Treasury rolloff caps at $5 billion per month and agency MBS caps at $35 billion per month to ensure ample reserves and market stability.
- The next meeting is scheduled for 27 to 28 January 2026.
Next 24 Hours Bias
Medium Bearish
Gold (XAU)
Key news events today
ADP Weekly Employment Change (Tentative)
Average Hourly Earnings m/m (1:30 pm GMT)
Core Retail Sales m/m (1:30 pm GMT)
Non-Farm Employment Change (1:30 pm GMT)
Retail Sales m/m (1:30 pm GMT)
Unemployment Rate (1:30 pm GMT)
Flash Manufacturing PMI (2:45 pm GMT)
Flash Services PMI (2:45 pm GMT)
What can we expect from Gold today?
Gold is trading near record territory on Tuesday, hovering around the 4,330–4,350 USD/oz area after a powerful multi‑week rally fuelled by Federal Reserve rate cuts, softer real yields, and strong safe‑haven demand. The short‑term tone is still bullish, but momentum is moderating, with intraday focus on whether upcoming U.S. labour data later today will push prices to retest October’s all‑time highs around 4,380–4,400 USD/oz or trigger a consolidation from elevated levels.
Next 24 Hours Bias
Strong Bullish
The Australian Dollar (AUD)
Key news events today
No major news event
What can we expect from AUD today?
The Australian Dollar enters Tuesday on a firm footing, trading just below recent highs as markets digest a steady but hawkish RBA, softer but still resilient domestic data, and a comparatively more dovish Federal Reserve backdrop. While lingering concerns about China’s growth and patchy labour figures could cap further near‑term gains, the combination of supportive yield differentials and expectations for stable to slightly higher Australian rates keeps sentiment toward the AUD constructive in the short to medium term.
Central Bank Notes:
- The Reserve Bank of Australia held its cash rate steady at 3.60% at the November 2025 policy meeting, adopting a cautious tone amid a surprise uptick in inflation data for the September quarter. This marks the fourth consecutive pause since the 25 basis point cut in August. The Board attributed some of the inflation rise to temporary factors like higher petrol prices and council rates, but noted signs of more persistent pressures from consumer demand.
- Policymakers emphasized vigilance on inflation, with trimmed mean inflation expected to remain elevated in the near term before nearing the 2–3% target midpoint by mid-2027. Recent data showed underlying inflation staying above target until at least the second half of 2026, prompting upward revisions to forecasts. Capacity pressures are seen as slightly more pronounced than previously assessed, delaying any easing.
- Headline CPI for the September quarter exceeded expectations, driven partly by temporary items, while underlying measures signal ongoing stickiness. The shift to monthly CPI reporting, with the first full edition in November 2025, will enhance real-time inflation monitoring. Housing and services remain resilient contributors to price pressures.
- Domestic demand shows firmness in services alongside below-trend growth elsewhere, with capacity pressures not expected to ease significantly. The labor market is gradually softening, with unemployment projected to stabilize around 4.4%, though wage growth and productivity dynamics keep unit labor costs a concern. Household spending faces headwinds from high borrowing costs.
- Global risks include geopolitical tensions and commodity volatility, set against modestly revised-up world growth outlooks. The Board describes its policy as mildly restrictive and data-dependent, balancing inflation control with employment goals. No rate hike was considered despite the inflation surprise.
- Monetary policy remains mildly restrictive to address lingering price stability risks amid household and global vulnerabilities. Communications reaffirm the dual mandate of 2–3% inflation and full employment, with readiness to adjust based on incoming data.
- Market expectations point to the cash rate holding through early 2026, with a possible modest cut to 3.3% mid-year if inflation eases as forecast. The new monthly CPI data will be key for timely insights.
- Monetary policy remains mildly restrictive, balancing progress on price stability against vulnerabilities in household demand and global outlook. Board communications reaffirm a dual mandate: price stability and full employment, while underscoring readiness to respond should risks materialize sharply.
- Analysts generally expect the cash rate to remain at current levels through early 2026, with only modest cuts possible later in the year if inflation moderates. The new monthly CPI release (first full edition Nov 2025) will be watched closely for timely signals on price trends.
- The next meeting is on 2 to 3 February 2026.
Next 24 Hours Bias
Medium Bullish
The Kiwi Dollar (NZD)
Key news events today
No major news event
What can we expect from NZD today?
The New Zealand Dollar is holding firm near the 0.58 level against the US Dollar after a recent climb to multi‑week highs, underpinned by expectations that the Reserve Bank of New Zealand is nearing the end of its rate‑cut cycle and by a softer US Dollar. However, lingering concerns about the strength of China’s recovery and the global growth outlook are tempering bullish momentum, leaving the NZD in a consolidative range as traders await the next round of key data and central‑bank signals.
Central Bank Notes:
- The Monetary Policy Committee (MPC) left the Official Cash Rate (OCR) unchanged at 2.25% at its 26 November 2025 meeting, following the widely anticipated 25-basis-point reduction from 2.50%, and signaled that policy is now firmly in stimulatory territory while keeping the option of further easing on the table if needed.
- The decision was again reached by consensus, with members judging that the cumulative 325 basis points of easing over the past year warranted a period of assessment, even as several emphasized a willingness to cut further should incoming data point to a more protracted downturn or renewed disinflationary pressures.
- Headline consumer price inflation is projected to hover near 3% in late 2025 before gradually easing toward the 2% midpoint of the 1–3% target band through 2026, supported by contained inflation expectations around 2.3% over the two-year horizon and an expected pickup in spare capacity.
- The MPC noted that domestic demand remains subdued but shows tentative signs of stabilisation, with softer household spending and construction only partially offset by improving services activity; nevertheless, policymakers still expect services inflation to ease as wage growth moderates and the labour market loosens further over the coming year.
- Financial conditions continue to ease as wholesale and retail borrowing rates reprice to the lower OCR, contributing to gradually rising mortgage approvals and improving housing-related sentiment, although broader business credit growth remains patchy and sensitive to uncertainty about the durability of the recovery.
- Recent data confirm that GDP momentum is weak but not deteriorating as sharply as earlier in 2025, with high-frequency indicators pointing to a shallow recovery from a low base and ongoing headwinds from elevated living costs and fragile confidence weighing on discretionary consumption and investment.
- The MPC reiterated that external risks remain skewed to the downside, particularly from softer Chinese demand and uncertainty around United States trade policy, but noted that a lower New Zealand dollar continues to provide some offset via improved export competitiveness and support for tradables inflation.
- Looking ahead to early 2026, the Committee maintained a mild easing bias, indicating that a further cut toward 2.00–2.10% cannot be ruled out if activity fails to gain traction or if inflation undershoots projections, but current forecasts envisage the OCR remaining near 2.25% for an extended period provided inflation converges toward target and the recovery proceeds broadly as expected.
- The next meeting is on 18 February 2026.
Next 24 Hours Bias
Medium Bullish
The Japanese Yen (JPY)
Key news events today
No major news event
What can we expect from JPY today?
Today, the Japanese yen is trading slightly firmer around the mid‑155 per dollar area, benefitting from safe‑haven demand and rising expectations that the Bank of Japan will hike rates from 0.5% to 0.75% at this week’s policy meeting, even as it remains weak by historical standards. Improved business confidence readings and persistent concern over past yen weakness have encouraged markets to price in a more hawkish BoJ path, while simultaneous bets on further Federal Reserve rate cuts have narrowed US‑Japan yield differentials and pressured USD/JPY off its recent highs near 157–158.
Central Bank Notes:
- The Policy Board of the Bank of Japan met on 30–31 October and, by a clear majority vote, decided to maintain its key monetary policy approach for the upcoming period.
- The BOJ will continue to encourage the uncollateralized overnight call rate to remain at around 0.5%, in line with the prior stance.
- The gradual quarterly reduction in monthly outright purchases of Japanese Government Bonds (JGBs) remains intact, with amounts unchanged from the previous schedule. Purchases are set to decrease by about ¥400 billion per quarter through March 2026, shifting to about ¥200 billion per quarter from April to June 2026, and targeting a ¥2 trillion purchase level for Q1 2027. The bank reaffirmed its intention to maintain flexibility, with readiness to respond if market conditions warrant an adjustment.
- Japan’s economy continues to show moderate recovery, primarily led by solid capital expenditures, although export growth and corporate activity remain restrained by external demand uncertainty and the ongoing effects of U.S. trade policies.
- Annual headline inflation (excluding fresh food) accelerated to 2.9% year-on-year in September, marking the first uptick in four months and staying above the BOJ’s 2% target. Broad-based inflation persists, with food and energy cost pressures, but wage growth continues to support household consumption. Input cost pressures from the earlier surge in imports eased slightly.
- Short-term inflation momentum could moderate as food-price hikes ease, though rent, healthcare, and service-sector price increases tied to labor shortages provide support. Firms and households maintain a gradual upward drift in inflation expectations.
- For the near term, BOJ projects growth below trend as external demand stays subdued and corporate investment plans remain cautious. Still, accommodative financial conditions and steady gains in real labor income will underpin domestic consumption.
- Over the medium term, as overseas economies recover and trade conditions normalize, Japan’s growth potential should improve. Persistent labor market tightness, higher wage settlements, and rising medium- to long-term inflation expectations are expected to keep core inflation on a gradual upward trajectory, converging toward the 2% price stability target later in the forecast horizon.
- The next meeting is scheduled for 18 to 19 December 2025.
Next 24 Hours Bias
Medium Bearish
Oil
Key news events today
API Crude Oil Stock (8:30 pm GMT)
What can we expect from Oil today?
Today’s oil market tone is cautiously weak‑to‑neutral: prices are stabilising just above recent lows, but sentiment remains weighed down by expectations of ample supply and rising inventories, with rallies seen as vulnerable unless there is a clear bullish surprise on demand or a fresh supply disruption.
Next 24 Hours Bias
Medium Bearish
The post IC Markets Global – Asia Fundamental Forecast | 16 December 2025 first appeared on IC Markets | Official Blog.
IC Markets Global – Europe Fundamental Forecast | 16 December 2025
424571 December 16, 2025 15:00 ICMarkets Market News
IC Markets Global – Europe Fundamental Forecast | 16 December 2025
What happened in the Asia session?
Asian markets traded defensively on December 16, 2025, with equities like Nikkei and Kospi leading losses (down ~1%) due to Wall Street rotation and pending US data, alongside softer NZ spending and awaited India PMIs; yen and gold gained while AUDUSD weakened. The Nikkei 225 dropped 1.27% (basic materials and real estate sectors were hit hardest), while the Kospi fell 0.75-1.13%. Additionally, GIFT Nifty futures declined 0.10%. Yen strengthened notably ahead of BOJ, AUDUSD slipped 0.2% to 0.6639 post-Australia’s softer PMI, while gold steadied as a haven.
What does it mean for the Europe & US sessions?
As European and U.S. sessions open, trading remains cautious with sparse data focusing on ECB updates and minor U.S. inventories, while eyes fix on Tuesday’s delayed U.S. retail sales and jobs report, plus Thursday’s ECB meeting expected to hold rates at 2%. Positive European equity momentum persists amid bank strength and global policy hopes, but dollar volatility looms from U.S. figures.
The Dollar Index (DXY)
Key news events today
ADP Weekly Employment Change (Tentative)
Average Hourly Earnings m/m (1:30 pm GMT)
Core Retail Sales m/m (1:30 pm GMT)
Non-Farm Employment Change (1:30 pm GMT)
Retail Sales m/m (1:30 pm GMT)
Unemployment Rate (1:30 pm GMT)
Flash Manufacturing PMI (2:45 pm GMT)
Flash Services PMI (2:45 pm GMT)
What can we expect from DXY today?
On Tuesday, the US dollar remained defensive near multi-month lows, with the DXY index dipping to 98.26 as markets braced for long-delayed October-November jobs data at 8:30 a.m. ET, delayed by the longest US government shutdown on record; this follows a recent Fed rate cut to 3.50-3.75% and signals of more easing, amplifying year-to-date losses exceeding 9% amid cooling labor indicators and falling Treasury yields.
Central Bank Notes:
- The Federal Open Market Committee (FOMC) is widely expected to lower the federal funds rate target range by 25 basis points to 3.50%–3.75% at its December 9–10, 2025, meeting, marking the third consecutive cut after the October reduction to 3.75%–4.00%
- The Committee continues to pursue maximum employment and 2% inflation goals, with the labor market showing further softening as the unemployment rate rose to 4.4% in September 2025 amid modest job gains.
- Officials note persistent downside risks to growth alongside resilient activity, with inflation easing to 3.0% year-over-year CPI in September but remaining elevated due to tariff effects; core PCE stands at around 2.8% as of October.
- Economic activity grew at a 3.8% annualized pace in Q2 2025 per revised estimates, though Q3 and Q4 face headwinds from trade tensions, fiscal restraint, and data disruptions like the government shutdown.
- September’s Summary of Economic Projections forecasts 2025 unemployment at a median 4.5%, with PCE inflation near 3.0% and core PCE at 3.1%, signaling a gradual disinflation path; updates expected on December 10 may adjust for higher unemployment and lower growth.
- The Committee maintained its data-dependent approach, noting a softening labor market and inflation above the 2% target, while deciding to lower the federal funds rate target range by 25 basis points to 3.50%-3.75%. Dissent persisted, with multiple members opposing the cut or advocating for a hold, reflecting divisions similar to recent meetings.
- The FOMC confirmed the conclusion of its quantitative tightening program effective December 1, 2025, with Treasury rolloff caps at $5 billion per month and agency MBS caps at $35 billion per month to ensure ample reserves and market stability.
- The next meeting is scheduled for 27 to 28 January 2026.
Next 24 Hours Bias
Medium Bearish
Gold (XAU)
Key news events today
ADP Weekly Employment Change (Tentative)
Average Hourly Earnings m/m (1:30 pm GMT)
Core Retail Sales m/m (1:30 pm GMT)
Non-Farm Employment Change (1:30 pm GMT)
Retail Sales m/m (1:30 pm GMT)
Unemployment Rate (1:30 pm GMT)
Flash Manufacturing PMI (2:45 pm GMT)
Flash Services PMI (2:45 pm GMT)
Empire State Manufacturing Index (1:30 pm GMT)
What can we expect from Gold today?
Gold is trading a little above 4,300 USD/oz today, Tuesday, hovering near record highs as investors continue to rotate toward safe‑haven assets and away from risk amid a softer dollar and lower real yields. The dominant narrative is that expectations for further US Federal Reserve rate cuts in 2026, combined with ongoing macro and geopolitical uncertainty, are underpinning strong bullion demand and encouraging buy‑on‑dip behavior from both traders and longer‑term allocators.
Next 24 Hours Bias
Medium Bullish
The Euro (EUR)
Key news events today
French Flash Manufacturing PMI (8:15 am GMT
French Flash Services PMI (8:15 am GMT)
German Flash Manufacturing PMI (8:30 am GMT)
German Flash Services PMI (8:30 am GMT)
What can we expect from EUR today?
On Tuesday, the euro is consolidating near recent highs against the U.S. dollar, with EUR/USD hovering in the mid‑1.17s after a strong 12‑month run, but short‑term trading is choppy as the pair stalls below key resistance around 1.18. A stable macro backdrop in the euro area with inflation slightly above 2% and modest but resilient growth supports expectations that the ECB will keep rates unchanged, while continuing balance‑sheet runoff.
Central Bank Notes:
- The Governing Council of the ECB kept the three key interest rates unchanged at its 30 October 2025 meeting. The main refinancing rate remains at 2.15%, the marginal lending facility at 2.40%, and the deposit facility at 2.00%. This decision reflects policymakers’ assessment that the current monetary stance remains consistent with medium-term price stability, while incoming data confirm a gradual return of inflation towards the target.
- Recent indicators point to stable price dynamics. Headline inflation remains near the 2% mark, with energy prices contained and food inflation easing slightly after earlier supply bottlenecks. Wage growth continues to moderate, contributing to the slowdown in domestic cost pressures. The ECB reiterated its commitment to a data-driven, meeting-by-meeting approach and emphasized flexibility amid uncertain global financial conditions.
- Eurosystem staff projections have not been materially altered since September. Headline inflation averages remain at 2.0% for 2025, 1.8% for 2026, and 2.0% for 2027. Recent softening in producer prices and subdued pipeline pressures suggest limited upside risks to inflation, though geopolitical tensions and potential commodity shocks continue to pose uncertainties to the outlook.
- Euro area GDP growth remains on track with earlier forecasts, projected at 1.1% for 2025, 1.1% for 2026, and 1.4% for 2027. Forward-looking indicators, including PMIs and industrial sentiment surveys, signal some stabilization in activity following weakness in the third quarter. Public investment and recovering export activity are expected to offset softer private sector demand in the near term.
- The labor market remains resilient, with unemployment rates at multi-decade lows and participation rates strong. Real income growth continues to support household spending, even as consumption growth normalizes from earlier highs. Financing conditions remain favorable, supported by stable banking-sector liquidity and improved credit demand among small and medium-sized firms.
- Business sentiment remains mixed, reflecting lingering uncertainty over global trade policy and the path of US tariffs. However, easing supply chain costs and improved export competitiveness due to softer exchange rates are providing some relief to manufacturing and external-oriented sectors.
- The Governing Council reaffirmed that future decisions will depend on an integrated assessment of incoming data—covering inflation trends, financial conditions, and the state of policy transmission. The Council emphasized that no pre-set path for rates exists; keeping all options open should the economic outlook shift markedly.
- Balance sheet reduction continues smoothly, with holdings under the APP and PEPP declining as reinvestments have ceased. The ECB confirmed that the pace of portfolio runoff remains in line with its previously communicated normalization plan, supporting a gradual withdrawal of monetary accommodation in a predictable manner.
- The next meeting is on 17 to 18 December 2025
Next 24 Hours Bias
Medium Bullish
The Swiss Franc (CHF)
Key news events today
No major news event
What can we expect from CHF today?
The Swiss franc remains one of the strongest major currencies going into Tuesday, 16 December 2025, with USD/CHF consolidating just under 0.80 and EUR/CHF near recent lows after the SNB kept its policy rate at 0% last week and slightly upgraded its growth outlook while signaling readiness to intervene in FX markets if needed. Persistently weak producer and import prices highlight ongoing deflationary pressure, but with inflation viewed as contained and the franc still in demand as a safe‑haven asset, markets expect the SNB to keep rates unchanged for an extended period and manage the currency mainly through interventions rather than renewed negative rates.
Central Bank Notes:
- At its 11 December 2025 monetary policy assessment, the Swiss National Bank (SNB) is widely expected to leave the policy rate unchanged at 0%, extending the pause that began in September as the Governing Board judges that current settings are sufficient to keep inflation near, but still below, its target while avoiding an unnecessary move into negative rates.
- Recent data show that the tentative rebound in Swiss inflation has stalled, with headline CPI easing from 0.1% year‑on‑year in October to 0.0% in November and core inflation slipping to about 0.4%, reinforcing the view that underlying price pressures remain very weak and that deflation risks, while contained, have not fully disappeared.
- The SNB’s conditional inflation forecast is likely to remain close to the September projections, with inflation still seen averaging roughly 0.2% in 2025, 0.5% in 2026, and 0.7% in 2027 under an unchanged policy rate path, though the latest CPI prints argue for a slightly lower near‑term profile and keep open the option of renewed easing if activity or prices weaken further.
- The global backdrop has deteriorated further, as continuing U.S. tariff actions and softer external demand weigh on world trade, while uncertainty in key European and U.S. markets for Swiss exports persists, leaving the SNB cautious about the growth outlook despite Switzerland’s relatively resilient domestic demand.
- Business and labor‑market sentiment in export‑oriented manufacturing remains subdued, with firms reporting pressure on margins from the still‑strong franc and softer foreign orders, although the broader economy is still expected to grow at around 1–1.5% in 2025 and unemployment only drifting up gradually from low levels.
- The SNB continues to stress its willingness to act if deflation risks re‑emerge, reiterating that it can ease policy through renewed rate cuts or targeted foreign‑exchange intervention if necessary, while also highlighting its commitment to transparent communication, including the publication of detailed minutes from recent assessments and ongoing dialogue with international partners on FX policy
The next meeting is on 19 March 2026.
Next 24 Hours Bias
Medium Bullish
The Pound (GBP)
Key news events today
Claimant Count Change (7:00 am GMT)
Average Earnings Index 3m/y (7:00 am GMT)
Flash Manufacturing PMI (9:30 am GMT)
Flash Services PMI (9:30 am GMT)
What can we expect from GBP today?
Today, Tuesday, the pound is trading broadly sideways just above the mid‑1.33s against the dollar, consolidating after recent gains and an 8‑week high last week. Markets are focused on UK labour‑market data due this morning and the approaching BoE meeting, where a 25 bp rate cut is almost fully priced following weak October GDP and softer‑than‑expected inflation, which together are capping sterling’s upside.
Central Bank Notes:
- The Bank of England’s Monetary Policy Committee (MPC) met on 6 November 2025 and voted 7–2 to keep the Bank Rate unchanged at 4.00 percent for a second consecutive meeting. The decision reflects the Committee’s cautious approach as inflation remains above target, but underlying economic momentum continues to weaken. Two members maintained their votes for a 25-basis-point cut, citing further signs of labor-market softening and weak business sentiment.
- The BOE adjusted its guidance on quantitative tightening (QT), maintaining the reduced pace established in September. The planned reduction of UK government bond holdings remains at £67.5 billion over the next 12 months, leaving the current gilt balance near £550 billion. Policymakers described the recalibrated QT path as “appropriate for current market conditions,” emphasizing the importance of liquidity management amid heightened volatility.
- Headline inflation moderated slightly to 3.6 percent in October from 3.8 percent previously, driven by easing food and transport prices. However, core inflation has shown only gradual progress, holding near 3.9 percent. The MPC noted that services inflation and administered energy costs continue to exert pressure, highlighting the challenge of achieving the 2 percent target sustainably. The Committee’s latest projections see inflation falling toward 3 percent by mid-2026, with further downside expected if energy and wage dynamics continue to normalize.
- Economic activity remains subdued. Estimates place Q3 GDP growth close to zero, with both business output and consumer spending restrained. The unemployment rate has edged up to 4.8 percent, while pay growth cooled to just under 5 percent year-on-year. MPC members acknowledged that pay settlements are weakening further, signaling an easing in labor cost pressures as demand softens. Surveys from the manufacturing and services sectors suggest muted hiring intentions through year-end.
- International factors continue to complicate the policy outlook. Fluctuating oil prices—partly linked to renewed Middle East tensions—alongside fragile global demand have contributed to higher market volatility. The MPC reiterated that external shocks, including global food and energy disruptions, could temporarily slow the disinflation path but remain unlikely to derail the medium-term moderation in prices.
- The Committee assessed risks around inflation as balanced. Downside risks arise from sluggish domestic growth and declining real income momentum, while upside risks remain tied to elevated inflation expectations and stubborn services inflation. Policymakers emphasized the need for patience, maintaining that any rate cuts ahead of clear inflation progress could undermine confidence in policy credibility.
- The MPC’s overall stance remains restrictive but increasingly balanced, with future moves expected to follow a cautious, data-driven trajectory. The Committee reaffirmed that monetary policy will stay tight until there is compelling evidence that inflation is returning to the 2 percent target on a durable basis.
- The next meeting is on 18 December 2025.
Next 24 Hours Bias
Medium Bullish
The Canadian Dollar (CAD)
Key news events today
BOC Gov Macklem Speaks (5:45 pm GMT)
What can we expect from CAD today?
The Canadian dollar is slightly softer on the day but continues to trade near its strongest levels in about three months, with USD/CAD hovering around 1.377–1.378 as markets mark time ahead of key US labor and activity data releases later today. The recent CAD strength reflects a combination of a softer US dollar on growing Fed‑cut expectations, relatively resilient Canadian growth, and inflation that is close enough to target for the Bank of Canada to pause while still sounding somewhat more hawkish than the Fed at the margin.
Central Bank Notes:
- The Council noted that U.S. tariff tensions have eased slightly following early progress in bilateral discussions, though the external trade environment remains fragile. Businesses continue to hold back on long-term investment, with the Bank highlighting that sustained clarity on U.S. trade policy is needed to restore confidence.
- The Bank acknowledged that uncertainty persists despite the softer U.S. tone, as incoming data show limited improvement in export orders. The manufacturing sector has stabilized but remains below pre-2024 output levels, reflecting weak global demand and cautious corporate spending.
- Canada’s economy showed tentative signs of recovery in early Q4, with GDP estimated to expand by 0.3% in October after two quarters of contraction. Mining and energy activity strengthened modestly, aided by steady crude demand, while goods exports posted a fractional gain.
- Service sector growth remained uneven, supported mainly by tourism-related and technology services. However, retail spending and household consumption were subdued, constrained by slower job creation and lingering consumer caution. The Bank judged overall momentum as fragile but improving marginally.
- Housing activity showed modest reacceleration in major urban markets as mortgage rates stabilized near record lows. Nonetheless, affordability pressures and stricter lending standards continue to limit overall resale volumes, resulting in only a gradual recovery in the housing sector.
- Headline CPI inflation rose to 2.1% in October, reaching the Bank’s target for the first time in six months. Higher energy prices and a modest uptick in food and shelter costs drove the increase. Core inflation measures remained stable, suggesting underlying price pressures are contained.
- The Governing Council reiterated its data-dependent stance, indicating that the current policy rate remains appropriate amid tentative growth and balanced inflation risks. Officials noted that while additional stimulus is not ruled out, the emphasis has shifted toward monitoring the sustainability of the recovery rather than immediate rate adjustments.
- The next meeting is on 17 to 18 December 2025.
Next 24 Hours Bias
Medium Bullish
Oil
Key news events today
API Crude Oil Stock (8:30 pm GMT)
What can we expect from Oil today?
Oil markets are on the back foot today as traders fade geopolitical risk and refocus on a looming supply overhang. Brent and WTI are extending Monday’s declines, trading near 60 and 56 USD respectively, with price action driven by improving odds of a Russia‑Ukraine ceasefire, which could normalize Russian exports, alongside softer China data that undercuts the demand outlook. Against a backdrop where OPEC is signaling steady demand but the IEA warns of a sizable 2026 surplus, rallies are being sold, and the curve reflects a market wrestling with record or near‑record demand but even faster supply growth, keeping crude pinned near multi‑year lows for now.
Next 24 Hours Bias
Medium Bearish
The post IC Markets Global – Europe Fundamental Forecast | 16 December 2025 first appeared on IC Markets | Official Blog.
Tuesday 16th December 2025: Asian Markets Slide on Wall Street Weakness Ahead of Key U.S. Economic Data
424570 December 16, 2025 15:00 ICMarkets Market News
Global Markets:
- Asian Stock Markets : Nikkei down -1.24%, Shanghai Composite down -1.22%, Hang Seng down -1.98% ASX down -0.46%
- Commodities : Gold at $4,311.20 (-0.56%), Silver at $62.360 (-1.98%), Brent Oil at $60.21 (-0.59%), WTI Oil at $59.35 (-0.58%)
- Rates : US 10-year yield at 4.170, UK 10-year yield at 4.5020, Germany 10-year yield at 2.8508
News & Data:
- (CAD) CPI m/m 0.1% to 0.1% expected
- (CAD) Median CPI y/y 2.8% to 2.9% expected
- (CAD) Trimmed CPI y/y 2.8% to 2.9% expected
Markets Update:
Asian stock markets are trading mostly lower on Tuesday, tracking broadly negative cues from Wall Street overnight, as continued weakness in energy and technology stocks weighs on sentiment. Uncertainty surrounding future AI spending and fears of a potential tech bubble have made investors cautious, while traders are also reluctant to take large positions ahead of key U.S. economic data releases later this week, including retail sales and inflation figures. Asian markets had ended mostly lower on Monday.
The upcoming data could influence expectations for interest rates following the U.S. Federal Reserve’s policy decision last week. Although the Fed delivered a widely expected quarter-point rate cut, its projections revealed sharp divisions among policymakers over the pace and extent of further easing.
In Australia, the stock market is trading modestly lower after an early uptick, extending the previous session’s losses amid weakness in energy and technology shares. The benchmark S&P/ASX 200 is hovering below the 8,650 level, with mixed performances across other sectors. Mining stocks are mixed, oil stocks are broadly weaker, while gold miners are mostly higher. Banking shares are narrowly mixed, and tech stocks remain under pressure.
In Japan, stocks are sharply lower, with the Nikkei 225 slipping below the 49,800 level as losses in heavyweight, exporter, and banking stocks drag the market down. Elsewhere in Asia, most major markets are also lower.
On Wall Street, U.S. stocks finished modestly lower on Monday after early gains faded, while European markets traded mostly higher. Crude oil prices declined on oversupply concerns.
Upcoming Events:
- 01:30 PM GMT – USD Core Retail Sales m/m
- 01:30 PM GMT – USD Non-Farm Employment Change
- 01:30 PM GMT – USD Retail Sales m/m
- 01:30 PM GMT – USD Unemployment Rate
The post Tuesday 16th December 2025: Asian Markets Slide on Wall Street Weakness Ahead of Key U.S. Economic Data first appeared on IC Markets | Official Blog.
General Market Analysis – 15/12/25
424544 December 15, 2025 16:39 ICMarkets Market News
US Stocks Lose Ground into the Weekend – Nasdaq Down 1.7%
US equity markets moved lower on Friday as investors grew increasingly cautious around stretched valuations in the technology sector, while comments from Federal Reserve officials reinforced concerns that inflation pressures may persist. The Dow Jones fell 0.50% to close at 48,458, while broader losses were seen in the S&P 500, which dropped 1.07% to 6,827. The Nasdaq underperformed, sliding 1.69% to finish at 23,195. The US dollar was little changed on the session, with the DXY edging just 0.05% higher to 98.39. Treasury yields were mixed, with the 2-year yield easing by 1.8 basis points to 3.522%, while the 10-year yield rose 2.7 basis points to 4.184%. Oil prices drifted modestly lower as oversupply concerns heading into the new year continued to weigh on sentiment. Brent slipped 0.26% to $61.12 a barrel, while WTI fell 0.28% to $57.44. In contrast, gold pushed higher, gaining 0.45% to $4,299.63, reaching its highest level in nearly two months as investors sought defensive exposure.
Non-Farms on a Tuesday to Move Markets
It is a huge day for financial markets on Tuesday, with delayed US employment numbers due out that will include data from both October and November. The impact of the US government’s largest-ever shutdown is still reverberating around financial markets, and tomorrow’s Non-Farms data being released on a Tuesday is another strange update for seasoned campaigners who are used to the usual Friday release. Estimates are varied across the market due to the data blackout in October and November, and therefore traders are expecting plenty of volatility around the event. The variation in estimates is fairly wide for the headline figure, but a range of +50k to +80k seems to cover most of the market, and any significant deviation will see strong moves across all financial products.
Quiet Start to a Busy Calendar Week
It is a quiet start to the week on the macroeconomic calendar, although traders are positioning ahead of a very busy period of central bank meetings and key economic data releases over the coming days, which are expected to drive volatility across markets. There is a big data dump due out of China during the Asian session today, with the highlights being Industrial Production (exp +5.0% y/y) and Retail Sales (exp +3.0% y/y), which could move local markets. There is little scheduled in the London session; however, key inflation data due out of Canada should see some volatility in the loonie. The monthly CPI number is expected to show a 0.1% increase, with the median year-on-year data expected to print at +2.9%. The US Empire State Manufacturing Index data is due out at the same time, with a +9.8 figure priced into the market. We also hear from Fed members Miran and Williams later in the day.
The post General Market Analysis – 15/12/25 first appeared on IC Markets | Official Blog.
The Week Ahead – Week Commencing 15 December 2025
424538 December 15, 2025 16:39 ICMarkets Market News
It was a busy week for financial markets last week, and it promises to be another one in the days ahead. There was a big central bank focus last week, with the RBA, the Bank of Canada, and the Swiss National Bank all holding rates steady, while we got the highly anticipated rate cut from the Federal Reserve.
The central bank focus continues this week, with key calls due from the Bank of England, the European Central Bank, and the Bank of Japan. In addition to the central bank action, there are some crucial data updates due out on the calendar as well, including a shutdown-delayed Non-Farm Payrolls and Retail Sales data run, and key inflation numbers from the US, UK, and Canada.
Traders are expecting this week to be the storm before the calm of Christmas week, and so plenty of volatility looks to be on the cards, with many products potentially at very different levels by 5pm NY time next Friday.
Here is our usual day-by-day breakdown of the major risk events this week:

It is a relatively quiet start to a busy week on Monday, with little on the calendar for the first two sessions of the day. The New York session sees the first top-tier data release of the week in the form of the Canadian CPI data; this comes out alongside the Empire State Manufacturing Index numbers. We are also due to hear from Fed members Williams and Miran during the afternoon.

It is a huge day on the calendar on Tuesday. There is a raft of flash services and manufacturing PMI data out across several jurisdictions, but the big moves will likely come from employment data releases, with key numbers due out from the UK and the US. The US session not only sees the Non-Farm Payrolls release—11 days late, as the BLS continues to play catch-up after the shutdown—but also delayed Retail Sales numbers, and traders are expecting a very busy day around the data.

Again, the Asian session has little on the calendar on Wednesday; however, the focus will be on UK markets as Europe comes in with the latest CPI data due out. Attention then jumps across the Channel for the German IFO Business Climate data. The New York session is quiet in terms of data releases, with just the weekly crude oil inventory numbers out; however, we do hear more Fed updates, with members Waller, Williams, and Bostic speaking.

It is another massive calendar day on Thursday, and things kick off early with New Zealand GDP data out early in the Asian session. The London session is dominated by central bank action, with both the Bank of England and the European Central Bank set to make interest rate decisions, and the New York session sees the release of key US CPI data, the weekly unemployment claims numbers, and the Philly Fed Manufacturing Index figures.

It is a busy final trading day of the week on Friday, with the major focus on Japanese markets during the Asian session as the Bank of Japan announces its latest rate call. UK markets are again in focus on the London open, with Retail Sales data due out. The New York session sees the initial focus north of the border for Canadian Retail Sales numbers, before US Existing Home Sales data is released alongside the University of Michigan revised consumer sentiment and inflation expectations updates.
The post The Week Ahead – Week Commencing 15 December 2025 first appeared on IC Markets | Official Blog.
IC Markets Global – Europe Fundamental Forecast | 15 December 2025
424537 December 15, 2025 16:14 ICMarkets Market News
IC Markets Global – Europe Fundamental Forecast | 15 December 2025
What happened in the Asia session?
During today’s Asia session, sentiment was dominated by a combination of global tech weakness and local macro themes: a strong Japanese Tankan survey kept speculation alive that the BOJ may soon hike rates, while traders positioned cautiously ahead of key Chinese November data expected to highlight weak domestic demand despite resilient industrial output. This backdrop, together with lingering fears over an AI‑driven valuation bubble and recent Wall Street tech losses, pushed major Asian equity indices lower, particularly the Kospi, Hang Seng futures, Australian ASX 200, and Japan’s benchmarks, while the yen, yuan, and AUD were the main FX crosses in focus, and Bitcoin extended its slide as risk appetite stayed muted.
What does it mean for the Europe & US sessions?
Today opens a busy macro week: traders should focus on Eurozone industrial production, Swiss SECO forecasts, and Canadian CPI as early tests of growth and inflation momentum, while positioning in EUR, CAD and CHF and in European and US indices will be shaped by how these releases feed into expectations for next steps from the ECB, BoE, BoJ and the Federal Reserve.
The Dollar Index (DXY)
Key news events today
Empire State Manufacturing Index (1:30 pm GMT)
What can we expect from DXY today?
The dollar starts Monday, on the back foot but not in free‑fall, trading just under the 99 DXY level after recent declines as investors wait for US retail sales and PMI releases that will refine expectations for the pace of future Fed easing. Technical breaks below prior support and weekly bearish candles point to a medium‑term softening trend, while macro forecasts and the cumulative effect of three Fed cuts suggest further, though measured, dollar weakness into 2026. Traders are therefore treating intraday bounces as largely corrective within a broader sideways‑to‑lower profile rather than the start of a new bullish phase for the greenback.
Central Bank Notes:
- The Federal Open Market Committee (FOMC) is widely expected to lower the federal funds rate target range by 25 basis points to 3.50%–3.75% at its December 9–10, 2025, meeting, marking the third consecutive cut after the October reduction to 3.75%–4.00%
- The Committee continues to pursue maximum employment and 2% inflation goals, with the labor market showing further softening as the unemployment rate rose to 4.4% in September 2025 amid modest job gains.
- Officials note persistent downside risks to growth alongside resilient activity, with inflation easing to 3.0% year-over-year CPI in September but remaining elevated due to tariff effects; core PCE stands at around 2.8% as of October.
- Economic activity grew at a 3.8% annualized pace in Q2 2025 per revised estimates, though Q3 and Q4 face headwinds from trade tensions, fiscal restraint, and data disruptions like the government shutdown.
- September’s Summary of Economic Projections forecasts 2025 unemployment at a median 4.5%, with PCE inflation near 3.0% and core PCE at 3.1%, signaling a gradual disinflation path; updates expected on December 10 may adjust for higher unemployment and lower growth.
- The Committee maintained its data-dependent approach, noting a softening labor market and inflation above the 2% target, while deciding to lower the federal funds rate target range by 25 basis points to 3.50%-3.75%. Dissent persisted, with multiple members opposing the cut or advocating for a hold, reflecting divisions similar to recent meetings.
- The FOMC confirmed the conclusion of its quantitative tightening program effective December 1, 2025, with Treasury rolloff caps at $5 billion per month and agency MBS caps at $35 billion per month to ensure ample reserves and market stability.
- The next meeting is scheduled for 27 to 28 January 2026.
Next 24 Hours Bias
Medium bearish
Gold (XAU)
Key news events today
Empire State Manufacturing Index (1:30 pm GMT)
What can we expect from Gold today?
Gold starts Monday, trading near the upper end of its recent range around 4,250–4,300 USD/oz, consolidating just below record highs after a powerful year‑long rally driven by Fed rate cuts, lower real yields, and a weaker dollar. Market commentary for the week ahead points to an intact bullish structure with support in the low‑4,100s and potential for renewed upside if dips attract buyers, but also notes overbought conditions, heavy speculative positioning, and the risk of sharp corrections should profit‑taking accelerate or the dollar rebound.
Next 24 Hours Bias
Strong Bullish
The Euro (EUR)
Key news events today
No major news event
What can we expect from EUR today?
The euro starts Monday on a firm footing, with EUR/USD trading around 1.17 near a two‑month high as traders respond to a softer US dollar following the Fed’s recent rate cut and to relatively hawkish messaging from the ECB. Technical structures and current positioning still lean modestly bullish for the euro, but with the pair pressing into a significant resistance band, markets expect choppy, headline‑driven trading as investors reassess interest‑rate paths on both sides of the Atlantic over the coming days.
Central Bank Notes:
- The Governing Council of the ECB kept the three key interest rates unchanged at its 30 October 2025 meeting. The main refinancing rate remains at 2.15%, the marginal lending facility at 2.40%, and the deposit facility at 2.00%. This decision reflects policymakers’ assessment that the current monetary stance remains consistent with medium-term price stability, while incoming data confirm a gradual return of inflation towards the target.
- Recent indicators point to stable price dynamics. Headline inflation remains near the 2% mark, with energy prices contained and food inflation easing slightly after earlier supply bottlenecks. Wage growth continues to moderate, contributing to the slowdown in domestic cost pressures. The ECB reiterated its commitment to a data-driven, meeting-by-meeting approach and emphasized flexibility amid uncertain global financial conditions.
- Eurosystem staff projections have not been materially altered since September. Headline inflation averages remain at 2.0% for 2025, 1.8% for 2026, and 2.0% for 2027. Recent softening in producer prices and subdued pipeline pressures suggest limited upside risks to inflation, though geopolitical tensions and potential commodity shocks continue to pose uncertainties to the outlook.
- Euro area GDP growth remains on track with earlier forecasts, projected at 1.1% for 2025, 1.1% for 2026, and 1.4% for 2027. Forward-looking indicators, including PMIs and industrial sentiment surveys, signal some stabilization in activity following weakness in the third quarter. Public investment and recovering export activity are expected to offset softer private sector demand in the near term.
- The labor market remains resilient, with unemployment rates at multi-decade lows and participation rates strong. Real income growth continues to support household spending, even as consumption growth normalizes from earlier highs. Financing conditions remain favorable, supported by stable banking-sector liquidity and improved credit demand among small and medium-sized firms.
- Business sentiment remains mixed, reflecting lingering uncertainty over global trade policy and the path of US tariffs. However, easing supply chain costs and improved export competitiveness due to softer exchange rates are providing some relief to manufacturing and external-oriented sectors.
- The Governing Council reaffirmed that future decisions will depend on an integrated assessment of incoming data—covering inflation trends, financial conditions, and the state of policy transmission. The Council emphasized that no pre-set path for rates exists; keeping all options open should the economic outlook shift markedly.
- Balance sheet reduction continues smoothly, with holdings under the APP and PEPP declining as reinvestments have ceased. The ECB confirmed that the pace of portfolio runoff remains in line with its previously communicated normalization plan, supporting a gradual withdrawal of monetary accommodation in a predictable manner.
- The next meeting is on 17 to 18 December 2025
Next 24 Hours Bias
Medium Bullish
The Swiss Franc (CHF)
Key news events today
No major news event
What can we expect from CHF today?
The Swiss franc starts Monday on a firm footing, trading near multi‑year highs versus the dollar as markets digest an SNB that has stayed on hold at 0% but sounded marginally more optimistic thanks to lower US tariffs and resilient global demand, while a freshly eased Fed keeps downward pressure on the greenback. Recent data showing zero inflation and a small Q3 contraction mean Swiss policymakers still see risks from an overly strong currency, yet safe‑haven flows and improved trade prospects continue to underpin CHF, leaving it slightly softer on the month but significantly stronger year‑on‑year against major peers
Central Bank Notes:
- At its 11 December 2025 monetary policy assessment, the Swiss National Bank (SNB) is widely expected to leave the policy rate unchanged at 0%, extending the pause that began in September as the Governing Board judges that current settings are sufficient to keep inflation near, but still below, its target while avoiding an unnecessary move into negative rates.
- Recent data show that the tentative rebound in Swiss inflation has stalled, with headline CPI easing from 0.1% year‑on‑year in October to 0.0% in November and core inflation slipping to about 0.4%, reinforcing the view that underlying price pressures remain very weak and that deflation risks, while contained, have not fully disappeared.
- The SNB’s conditional inflation forecast is likely to remain close to the September projections, with inflation still seen averaging roughly 0.2% in 2025, 0.5% in 2026, and 0.7% in 2027 under an unchanged policy rate path, though the latest CPI prints argue for a slightly lower near‑term profile and keep open the option of renewed easing if activity or prices weaken further.
- The global backdrop has deteriorated further, as continuing U.S. tariff actions and softer external demand weigh on world trade, while uncertainty in key European and U.S. markets for Swiss exports persists, leaving the SNB cautious about the growth outlook despite Switzerland’s relatively resilient domestic demand.
- Business and labor‑market sentiment in export‑oriented manufacturing remains subdued, with firms reporting pressure on margins from the still‑strong franc and softer foreign orders, although the broader economy is still expected to grow at around 1–1.5% in 2025 and unemployment only drifting up gradually from low levels.
- The SNB continues to stress its willingness to act if deflation risks re‑emerge, reiterating that it can ease policy through renewed rate cuts or targeted foreign‑exchange intervention if necessary, while also highlighting its commitment to transparent communication, including the publication of detailed minutes from recent assessments and ongoing dialogue with international partners on FX policy
The next meeting is on 19 March 2026.
Next 24 Hours Bias
Medium Bullish
The Pound (GBP)
Key news events today
No major news event
What can we expect from GBP today?
On Monday, the Pound is slightly weaker, with GBP/USD drifting down to the mid‑1.33s as traders trim exposure before crucial UK inflation figures and Thursday’s Bank of England meeting. Recent soft GDP and moderating inflation have increased expectations of a 25 bps BoE rate cut, weighing on Sterling and prompting some “sell‑on‑rally” strategies despite the currency’s still‑solid performance over the past month.
Central Bank Notes:
- The Bank of England’s Monetary Policy Committee (MPC) met on 6 November 2025 and voted 7–2 to keep the Bank Rate unchanged at 4.00 percent for a second consecutive meeting. The decision reflects the Committee’s cautious approach as inflation remains above target, but underlying economic momentum continues to weaken. Two members maintained their votes for a 25-basis-point cut, citing further signs of labor-market softening and weak business sentiment.
- The BOE adjusted its guidance on quantitative tightening (QT), maintaining the reduced pace established in September. The planned reduction of UK government bond holdings remains at £67.5 billion over the next 12 months, leaving the current gilt balance near £550 billion. Policymakers described the recalibrated QT path as “appropriate for current market conditions,” emphasizing the importance of liquidity management amid heightened volatility.
- Headline inflation moderated slightly to 3.6 percent in October from 3.8 percent previously, driven by easing food and transport prices. However, core inflation has shown only gradual progress, holding near 3.9 percent. The MPC noted that services inflation and administered energy costs continue to exert pressure, highlighting the challenge of achieving the 2 percent target sustainably. The Committee’s latest projections see inflation falling toward 3 percent by mid-2026, with further downside expected if energy and wage dynamics continue to normalize.
- Economic activity remains subdued. Estimates place Q3 GDP growth close to zero, with both business output and consumer spending restrained. The unemployment rate has edged up to 4.8 percent, while pay growth cooled to just under 5 percent year-on-year. MPC members acknowledged that pay settlements are weakening further, signaling an easing in labor cost pressures as demand softens. Surveys from the manufacturing and services sectors suggest muted hiring intentions through year-end.
- International factors continue to complicate the policy outlook. Fluctuating oil prices—partly linked to renewed Middle East tensions—alongside fragile global demand have contributed to higher market volatility. The MPC reiterated that external shocks, including global food and energy disruptions, could temporarily slow the disinflation path but remain unlikely to derail the medium-term moderation in prices.
- The Committee assessed risks around inflation as balanced. Downside risks arise from sluggish domestic growth and declining real income momentum, while upside risks remain tied to elevated inflation expectations and stubborn services inflation. Policymakers emphasized the need for patience, maintaining that any rate cuts ahead of clear inflation progress could undermine confidence in policy credibility.
- The MPC’s overall stance remains restrictive but increasingly balanced, with future moves expected to follow a cautious, data-driven trajectory. The Committee reaffirmed that monetary policy will stay tight until there is compelling evidence that inflation is returning to the 2 percent target on a durable basis.
- The next meeting is on 18 December 2025.
Next 24 Hours Bias
Medium Bullish
The Canadian Dollar (CAD)
Key news events today
CPI m/m (1:30 pm GMT)
Median CPI y/y (1:30 pm GMT)
Trimmed CPI y/y (1:30 pm GMT)
Common CPI y/y (1:30 pm GMT)
What can we expect from CAD today?
Going into Monday the Canadian dollar is trading near its strongest levels in roughly three months as USD/CAD hovers around the mid‑1.37s, underpinned by a perception that the Bank of Canada is effectively “done cutting” after holding rates at 2.25% last week and by expectations that today’s CPI, housing, and manufacturing data will show inflation still near target but growth only mildly softer. Markets are positioned for modest further CAD strength if inflation surprises higher or proves sticky.
Central Bank Notes:
- The Council noted that U.S. tariff tensions have eased slightly following early progress in bilateral discussions, though the external trade environment remains fragile. Businesses continue to hold back on long-term investment, with the Bank highlighting that sustained clarity on U.S. trade policy is needed to restore confidence.
- The Bank acknowledged that uncertainty persists despite the softer U.S. tone, as incoming data show limited improvement in export orders. The manufacturing sector has stabilized but remains below pre-2024 output levels, reflecting weak global demand and cautious corporate spending.
- Canada’s economy showed tentative signs of recovery in early Q4, with GDP estimated to expand by 0.3% in October after two quarters of contraction. Mining and energy activity strengthened modestly, aided by steady crude demand, while goods exports posted a fractional gain.
- Service sector growth remained uneven, supported mainly by tourism-related and technology services. However, retail spending and household consumption were subdued, constrained by slower job creation and lingering consumer caution. The Bank judged overall momentum as fragile but improving marginally.
- Housing activity showed modest reacceleration in major urban markets as mortgage rates stabilized near record lows. Nonetheless, affordability pressures and stricter lending standards continue to limit overall resale volumes, resulting in only a gradual recovery in the housing sector.
- Headline CPI inflation rose to 2.1% in October, reaching the Bank’s target for the first time in six months. Higher energy prices and a modest uptick in food and shelter costs drove the increase. Core inflation measures remained stable, suggesting underlying price pressures are contained.
- The Governing Council reiterated its data-dependent stance, indicating that the current policy rate remains appropriate amid tentative growth and balanced inflation risks. Officials noted that while additional stimulus is not ruled out, the emphasis has shifted toward monitoring the sustainability of the recovery rather than immediate rate adjustments.
- The next meeting is on 17 to 18 December 2025.
Next 24 Hours Bias
Medium Bullish
Oil
Key news events today
No major news event
What can we expect from Oil today?
On Monday, 15 December 2025, oil staged only a mild bounce, with Brent around the low 60s and WTI in the high 50s, after both benchmarks slid more than 4% last week and now trade near two‑month lows. The key narrative is that expectations of a sizable global surplus and high inventories outweigh fresh geopolitical worries, including U.S.–Venezuela tensions, so rallies are being sold and sentiment remains broadly bearish even as traders trim some short positions today.
Next 24 Hours Bias
Medium Bearish
The post IC Markets Global – Europe Fundamental Forecast | 15 December 2025 first appeared on IC Markets | Official Blog.
IC Markets Global – Asia Fundamental Forecast | 15 December 2025
424536 December 15, 2025 16:14 ICMarkets Market News
IC Markets Global – Asia Fundamental Forecast | 15 December 2025
What happened in the U.S. session?
Overnight U.S. trading was dominated less by fresh headlines than by positioning for a heavy upcoming data slate that will reveal how the economy has weathered the shutdown‑related blind spot. With investors debating whether the Fed will be able to deliver more than one additional rate cut next year, yields drifted higher, the dollar found a floor, and U.S. stocks slipped from recent records as money rotated away from speculative growth toward more defensive assets.
What does it mean for the Asia Session?
Going into Monday’s Asian session, trading desks should prioritize China’s early‑morning data dump on retail sales, industrial production, investment, and employment as the main scheduled catalyst, while also monitoring headlines around Japan-China tensions and any fresh signals on the Fed and Bank of Japan policy paths. For Asian traders, that argues for tight risk management around the China release window, sensitivity to moves in U.S. yields and the dollar, and close tracking of weekend geopolitical developments that could hit markets with gap risk at the open.
The Dollar Index (DXY)
Key news events today
Empire State Manufacturing Index (1:30 pm GMT)
What can we expect from DXY today?
On Monday, the dollar is stabilizing after recent losses but still trades near multi‑week lows, with the DXY index just below 99 and well off its highs for the year. Market participants remain focused on a cooling U.S. labor market and an established Fed easing cycle, both of which are seen capping any sustained dollar rallies into the end of 2025. Sentiment across FX desks is that the currency may experience short‑term bounce attempts, but the broader trend points to a softer dollar as investors rotate into higher‑yield and risk assets and position for further rate cuts in 2026.
Central Bank Notes:
- The Federal Open Market Committee (FOMC) is widely expected to lower the federal funds rate target range by 25 basis points to 3.50%–3.75% at its December 9–10, 2025, meeting, marking the third consecutive cut after the October reduction to 3.75%–4.00%
- The Committee continues to pursue maximum employment and 2% inflation goals, with the labor market showing further softening as the unemployment rate rose to 4.4% in September 2025 amid modest job gains.
- Officials note persistent downside risks to growth alongside resilient activity, with inflation easing to 3.0% year-over-year CPI in September but remaining elevated due to tariff effects; core PCE stands at around 2.8% as of October.
- Economic activity grew at a 3.8% annualized pace in Q2 2025 per revised estimates, though Q3 and Q4 face headwinds from trade tensions, fiscal restraint, and data disruptions like the government shutdown.
- September’s Summary of Economic Projections forecasts 2025 unemployment at a median 4.5%, with PCE inflation near 3.0% and core PCE at 3.1%, signaling a gradual disinflation path; updates expected on December 10 may adjust for higher unemployment and lower growth.
- The Committee maintained its data-dependent approach, noting a softening labor market and inflation above the 2% target, while deciding to lower the federal funds rate target range by 25 basis points to 3.50%-3.75%. Dissent persisted, with multiple members opposing the cut or advocating for a hold, reflecting divisions similar to recent meetings.
- The FOMC confirmed the conclusion of its quantitative tightening program effective December 1, 2025, with Treasury rolloff caps at $5 billion per month and agency MBS caps at $35 billion per month to ensure ample reserves and market stability.
- The next meeting is scheduled for 27 to 28 January 2026.
Next 24 Hours Bias
Medium Bearish
Gold (XAU)
Key news events today
Empire State Manufacturing Index (1:30 pm GMT)
What can we expect from Gold today?
Gold enters Monday, hovering just below record territory around 4,300 USD per ounce, supported by expectations of further Fed easing, softer US growth data, and persistent geopolitical risks. While the strategic trend remains clearly bullish, several analysts highlight nearby resistance and overbought signals, suggesting that short‑term price action may feature consolidation or shallow pullbacks within established support zones rather than an immediate sustained breakout.
Next 24 Hours Bias
Strong Bullish
The Australian Dollar (AUD)
Key news events today
No major news event
What can we expect from AUD today?
The Australian Dollar is trading slightly off recent highs but holding in the mid‑0.66 range against the US dollar, with price action muted by a lack of major Australian data or headlines on the calendar for Monday in local time. Recent support for the currency comes from the RBA’s decision to keep the cash rate at 3.60% while signalling concern about persistent inflation and ruling out near‑term cuts, which has led markets to delay expectations of easing and even factor in a small chance of another hike in 2026.
Central Bank Notes:
- The Reserve Bank of Australia held its cash rate steady at 3.60% at the November 2025 policy meeting, adopting a cautious tone amid a surprise uptick in inflation data for the September quarter. This marks the fourth consecutive pause since the 25 basis point cut in August. The Board attributed some of the inflation rise to temporary factors like higher petrol prices and council rates, but noted signs of more persistent pressures from consumer demand.
- Policymakers emphasized vigilance on inflation, with trimmed mean inflation expected to remain elevated in the near term before nearing the 2–3% target midpoint by mid-2027. Recent data showed underlying inflation staying above target until at least the second half of 2026, prompting upward revisions to forecasts. Capacity pressures are seen as slightly more pronounced than previously assessed, delaying any easing.
- Headline CPI for the September quarter exceeded expectations, driven partly by temporary items, while underlying measures signal ongoing stickiness. The shift to monthly CPI reporting, with the first full edition in November 2025, will enhance real-time inflation monitoring. Housing and services remain resilient contributors to price pressures.
- Domestic demand shows firmness in services alongside below-trend growth elsewhere, with capacity pressures not expected to ease significantly. The labor market is gradually softening, with unemployment projected to stabilize around 4.4%, though wage growth and productivity dynamics keep unit labor costs a concern. Household spending faces headwinds from high borrowing costs.
- Global risks include geopolitical tensions and commodity volatility, set against modestly revised-up world growth outlooks. The Board describes its policy as mildly restrictive and data-dependent, balancing inflation control with employment goals. No rate hike was considered despite the inflation surprise.
- Monetary policy remains mildly restrictive to address lingering price stability risks amid household and global vulnerabilities. Communications reaffirm the dual mandate of 2–3% inflation and full employment, with readiness to adjust based on incoming data.
- Market expectations point to the cash rate holding through early 2026, with a possible modest cut to 3.3% mid-year if inflation eases as forecast. The new monthly CPI data will be key for timely insights.
- Monetary policy remains mildly restrictive, balancing progress on price stability against vulnerabilities in household demand and global outlook. Board communications reaffirm a dual mandate: price stability and full employment, while underscoring readiness to respond should risks materialize sharply.
- Analysts generally expect the cash rate to remain at current levels through early 2026, with only modest cuts possible later in the year if inflation moderates. The new monthly CPI release (first full edition Nov 2025) will be watched closely for timely signals on price trends.
- The next meeting is on 2 to 3 February 2026.
Next 24 Hours Bias
Medium Bullish
The Kiwi Dollar (NZD)
Key news events today
No major news event
What can we expect from NZD today?
The New Zealand Dollar is holding firm near the 0.58 level against the US Dollar after a recent climb to multi‑week highs, underpinned by expectations that the Reserve Bank of New Zealand is nearing the end of its rate‑cut cycle and by a softer US Dollar. However, lingering concerns about the strength of China’s recovery and the global growth outlook are tempering bullish momentum, leaving the NZD in a consolidative range as traders await the next round of key data and central‑bank signals.
Central Bank Notes:
- The Monetary Policy Committee (MPC) left the Official Cash Rate (OCR) unchanged at 2.25% at its 26 November 2025 meeting, following the widely anticipated 25-basis-point reduction from 2.50%, and signaled that policy is now firmly in stimulatory territory while keeping the option of further easing on the table if needed.
- The decision was again reached by consensus, with members judging that the cumulative 325 basis points of easing over the past year warranted a period of assessment, even as several emphasized a willingness to cut further should incoming data point to a more protracted downturn or renewed disinflationary pressures.
- Headline consumer price inflation is projected to hover near 3% in late 2025 before gradually easing toward the 2% midpoint of the 1–3% target band through 2026, supported by contained inflation expectations around 2.3% over the two-year horizon and an expected pickup in spare capacity.
- The MPC noted that domestic demand remains subdued but shows tentative signs of stabilisation, with softer household spending and construction only partially offset by improving services activity; nevertheless, policymakers still expect services inflation to ease as wage growth moderates and the labour market loosens further over the coming year.
- Financial conditions continue to ease as wholesale and retail borrowing rates reprice to the lower OCR, contributing to gradually rising mortgage approvals and improving housing-related sentiment, although broader business credit growth remains patchy and sensitive to uncertainty about the durability of the recovery.
- Recent data confirm that GDP momentum is weak but not deteriorating as sharply as earlier in 2025, with high-frequency indicators pointing to a shallow recovery from a low base and ongoing headwinds from elevated living costs and fragile confidence weighing on discretionary consumption and investment.
- The MPC reiterated that external risks remain skewed to the downside, particularly from softer Chinese demand and uncertainty around United States trade policy, but noted that a lower New Zealand dollar continues to provide some offset via improved export competitiveness and support for tradables inflation.
- Looking ahead to early 2026, the Committee maintained a mild easing bias, indicating that a further cut toward 2.00–2.10% cannot be ruled out if activity fails to gain traction or if inflation undershoots projections, but current forecasts envisage the OCR remaining near 2.25% for an extended period provided inflation converges toward target and the recovery proceeds broadly as expected.
- The next meeting is on 18 February 2026.
Next 24 Hours Bias
Medium Bullish
The Japanese Yen (JPY)
Key news events today
No major news event
What can we expect from JPY today?
Today, the yen remains weak but relatively stable near the mid‑155s per dollar, as traders wait for the Bank of Japan’s crucial December meeting. Markets largely expect a 25‑basis‑point rate hike to 0.75%, which would mark the highest Japanese policy rate in about 30 years and could start to unwind some yen carry trades by narrowing the rate gap with the United States. Analysts see scope for yen strengthening if the BoJ delivers a clearly hawkish message, but persistent concerns about Japan’s growth and the risk of renewed yen weakness keep intervention fears in the background.
Central Bank Notes:
- The Policy Board of the Bank of Japan met on 30–31 October and, by a clear majority vote, decided to maintain its key monetary policy approach for the upcoming period.
- The BOJ will continue to encourage the uncollateralized overnight call rate to remain at around 0.5%, in line with the prior stance.
- The gradual quarterly reduction in monthly outright purchases of Japanese Government Bonds (JGBs) remains intact, with amounts unchanged from the previous schedule. Purchases are set to decrease by about ¥400 billion per quarter through March 2026, shifting to about ¥200 billion per quarter from April to June 2026, and targeting a ¥2 trillion purchase level for Q1 2027. The bank reaffirmed its intention to maintain flexibility, with readiness to respond if market conditions warrant an adjustment.
- Japan’s economy continues to show moderate recovery, primarily led by solid capital expenditures, although export growth and corporate activity remain restrained by external demand uncertainty and the ongoing effects of U.S. trade policies.
- Annual headline inflation (excluding fresh food) accelerated to 2.9% year-on-year in September, marking the first uptick in four months and staying above the BOJ’s 2% target. Broad-based inflation persists, with food and energy cost pressures, but wage growth continues to support household consumption. Input cost pressures from the earlier surge in imports eased slightly.
- Short-term inflation momentum could moderate as food-price hikes ease, though rent, healthcare, and service-sector price increases tied to labor shortages provide support. Firms and households maintain a gradual upward drift in inflation expectations.
- For the near term, BOJ projects growth below trend as external demand stays subdued and corporate investment plans remain cautious. Still, accommodative financial conditions and steady gains in real labor income will underpin domestic consumption.
- Over the medium term, as overseas economies recover and trade conditions normalize, Japan’s growth potential should improve. Persistent labor market tightness, higher wage settlements, and rising medium- to long-term inflation expectations are expected to keep core inflation on a gradual upward trajectory, converging toward the 2% price stability target later in the forecast horizon.
- The next meeting is scheduled for 18 to 19 December 2025.
Next 24 Hours Bias
Medium Bearish
Oil
Key news events today
No major news event
What can we expect from Oil today?
Oil prices today, Monday 14 December 2025, are trading weak near recent lows, with Brent hovering around the low‑60s per barrel and WTI in the high‑50s, as markets remain focused on oversupply risks and softening demand expectations. The International Energy Agency continues to project a sizeable surplus for 2026, while OPEC’s latest reports keep demand growth forecasts steady, signaling that producers may need to manage output carefully to avoid further downside pressure on prices.
Next 24 Hours Bias
Medium Bearish
The post IC Markets Global – Asia Fundamental Forecast | 15 December 2025 first appeared on IC Markets | Official Blog.
Monday 15th December 2025: Technical Outlook and Review
424520 December 15, 2025 16:00 ICMarkets Market News
DXY (U.S. Dollar Index):
Potential Direction: Bearish
Overall momentum of the chart: Bearish
The price has already reacted off the pivot and may continue its bearish move toward the 1st support.
Pivot: 99.23
Supporting reasons: Identified as an overlap resistance, where selling pressures could intensify and potentially cap any upward retracement
1st support: 97.18
Supporting reasons: Identified as a pullback support, indicating a potential area where the price could again stabilize.
1st resistance: 100.25
Supporting reasons: Identified as a multi-swing high resistance, indicating a potential area that could halt any further upward movement

EUR/USD:
Potential Direction: Bearish
Overall momentum of the chart: Bullish
The price could see a short-term pullback toward the pivot before continuing its bearish move down toward the 1st support.
Pivot: 1.1807
Supporting reasons: Identified as a pullback resistance, where selling pressures could intensify and potentially cap any upward retracement.
1st support: 1.1684
Supporting reasons: Identified as a pullback support, indicating a potential level where the price could stabilize once again.
1st resistance: 1.1921
Supporting reasons: Identified as a swing high resistance, indicating a potential level that could cap further upward movement.
EUR/JPY:
Potential Direction: Bullish
Overall momentum of the chart: Bullish
The price could make a short-term pullback toward the pivot before rising again toward the 1st resistance.
Pivot: 181.62
Supporting reasons: Identified as a pullback support, where renewed buying pressure could emerge to push the price higher.
1st support: 177.97
Supporting reasons: Identified as a pullback support, indicating a potential area where the price could again stabilize.
1st resistance: 188.13
Supporting reasons: Identified as a resistance that is supported by the 161.8% Fibonacci extension, indicating a potential level that could cap further upward movement.
EUR/GBP:
Potential Direction: Bullish
Overall momentum of the chart: Bullish
The price has already bounced off the pivot and may continue its bullish move toward the 1st resistance
Pivot: 0.8744
Supporting reasons: Identified as an overlap support, where renewed buying pressure could emerge to push the price higher.
1st support: 0.8607
Supporting reasons: Identified as an overlap support, indicating a potential area where the price could stabilize once more.
1st resistance: 0.8867
Supporting reasons: Identified as a swing high resistance, indicating a potential level that could cap further upward movement.
GBP/USD:
Potential Direction: Bearish
Overall momentum of the chart: Bullish
The price has already reacted off the pivot and may continue its bearish move toward the 1st support.
Pivot: 1.3394
Supporting reasons: Identified as an overlap resistance that aligns with the 50Fibonacci retracement, where selling pressures could intensify and potentially cap any upward retracement
1st support: 1.3208
Supporting reasons: Identified as an overlap support, indicating a potential area where the price could stabilize once more.
1st resistance: 1.3585
Supporting reasons: Identified as a pullback resistance, indicating a potential level that could halt further upward movement.

GBP/JPY:
Potential Direction: Bullish
Overall momentum of the chart: Bullish
The price could make a short-term pullback toward the pivot before rising again toward the 1st resistance
Pivot: 204,58
Supporting reasons: Identified as a pullback support, where renewed buying pressure could emerge to push the price higher.
1st support: 200.61
Supporting reasons: Identified as an overlap support, indicating a potential level where the price could stabilize once more.
1st resistance: 209.14
Supporting reasons: Identified as a resistance that aligns with the 161.8% Fibonacci extension, indicating a potential level that could halt further upward movement.
USD/CHF:
Potential Direction: Bullish
Overall momentum of the chart: Bearish
The price could see a short-term pullback toward the pivot before rising again toward the 1st resistance.
Pivot: 0.7875
Supporting reasons: Identified as an overlap support, where renewed buying pressure could emerge to push the price higher.
1st support: 0.7739
Supporting reasons: Identified as a support that is supported by the 161.8% Fibonacci extension, indicating a potential level where the price could stabilize once again.
1st resistance: 0.8084
Supporting reasons: Identified as an overlap resistance, indicating a potential level that could cap further upward movement.
USD/JPY:
Potential Direction: Bullish
Overall momentum of the chart: Bullish
The price could make a short-term pullback toward the pivot before rising again toward the 1st resistance
Pivot: 154.41
Supporting reasons: Identified as a pullback support, where renewed buying pressure could emerge to push the price higher.
1st support: 151.03
Supporting reasons: Identified as a pullback support, indicating a strong area where buyers might return, and the price could stabilize once again.
1st resistance: 158.33
Supporting reasons: Identified as an overlap resistance. This level represents the next key area where upward movement could be capped amid increased selling pressure

USD/CAD:
Potential Direction: Bearish
Overall momentum of the chart: Bearish
The price could see a short-term pullback toward the pivot before continuing its bearish move down toward the 1st support.
Pivot: 1.3916
Supporting reasons: Identified as a pullback resistance, where selling pressures could intensify and potentially cap any upward retracement.
1st support: 1.3761
Supporting reasons: Identified as an overlap support, indicating a key level where the price could stabilize once more.
1st resistance: 1.4107
Supporting reasons: Identified as a multi swing high resistance, making it a possible target for bullish advances and a level where some sellers could return to cap gains

AUD/USD:
Potential Direction: Bullish
Overall momentum of the chart: Bullish
The price could make a short-term pullback toward the pivot before rising again toward the 1st resistance
Pivot: 0.6538
Supporting reasons: Identified as a pullback support, where renewed buying pressure could emerge to push the price higher.
1st support: 0.6404
Supporting reasons: Identified as a pullback support, this area has provided strong support historically and may attract buying interest for a potential short-term bounce
1st resistance: 0.6681
Supporting reasons: Identified as a swing high resistance that aligns with the 161.8% Fibonacci extension, indicating a potential area that could halt any further upward movement.
NZD/USD
Potential Direction: Bullish
Overall momentum of the chart: Bearish
The price could make a short-term pullback toward the pivot before rising again toward the 1st resistance
Pivot: 0.5682
Supporting reasons: Identified as a pullback support, where renewed buying pressure could emerge to push the price higher.
1st support: 0.5584
Supporting reasons: Identified as a swing low support, this area has provided strong support historically and may attract buying interest for a potential short-term bounce
1st resistance: 0.5838
Supporting reasons: Identified as an overlap resistance that aligns with the 61.8% Fibonacci retracement, indicating a potential area that could halt any further upward movement.
US30 (DJIA):
Potential Direction: Bullish
Overall momentum of the chart: Bullish
The price could make a short-term pullback toward the pivot before rising again toward the 1st resistance
Pivot: 48,377.15
Supporting reasons: Identified as a pullback support, where renewed buying pressure could emerge to push the price higher.
1st support: 47,051.79
Supporting reasons: Identified as a pullback support, suggesting a potential area where the price could stabilize once again.
1st resistance: 50,097.97
Supporting reasons: Identified as a resistance that is supported by the 161.8% Fibonacci extension, indicating a potential area that could halt any further upward movement.
DE40 (DAX):
Potential Direction: Bullish
Overall momentum of the chart: Bullish
The price could make a short-term pullback toward the pivot before rising again toward the 1st resistance
Pivot: 23,834.30
Supporting reasons: Identified as a pullback support, where renewed buying pressure could emerge to push the price higher.
1st support: 23,059.30
Supporting reasons: Identified as a pullback support, indicating a key level where the price could stabilize once more.
1st resistance: 24,635.40
Supporting reasons: Identified as a multi-swing high resistance, indicating a potential area that could halt any further upward movement.

US500 (S&P 500):
Potential Direction: Bullish
Overall momentum of the chart: Bullish
The price could make a short-term pullback toward the pivot before rising again toward the 1st resistance
Pivot: 6,505.98
Supporting reasons: Identified as an overlap support, where renewed buying pressure could emerge to push the price higher.
1st support: 6,141.15
Supporting reasons: Identified as a pullback support that aligns with the 38.2% Fibonacci retracement, indicating a potential level where the price could stabilize once again.
1st resistance: 6,900.95
Supporting reasons: Identified as a swing high resistance, indicating a potential area that could halt any further upward movement.
BTC/USD (Bitcoin):
Potential Direction: Bearish
Overall momentum of the chart: Bullish
The price has already reacted off the pivot and may continue its bearish move toward the 1st support.
Pivot: 94,255.27
Supporting reasons: Identified as a pullback resistance that aligns with the 50% Fibonacci retracement, where selling pressures could intensify and potentially cap any upward retracement.
1st support: 80,712.26
Supporting reasons: Identified as an overlap support, indicating a potential level where the price could stabilize once more.
1st resistance: 106,846.29
Supporting reasons: Identified as an overlap resistance, indicating a potential area that could halt any further upward movement.
ETH/USD (Ethereum):
Potential Direction: Bearish
Overall momentum of the chart: Bullish
The price has already reacted off the pivot and may continue its bearish move toward the 1st support.
Pivot: 3,390.47
Supporting reasons: Identified as a pullback resistance, where selling pressures could intensify and potentially cap any upward retracement.
1st support: 2,725.92
Supporting reasons: Identified as an overlap support that aligns with the 61.8% Fibonacci retracement, indicating a potential level where the price could stabilize once more.
1st resistance: 3,838.62
Supporting reasons: Identified as a pullback resistance, indicating a potential area that could halt any further upward movement.
WTI/USD (Oil):
Potential Direction: Bearish
Overall momentum of the chart: Bullish
The price could see a short-term pullback toward the pivot before continuing its bearish move down toward the 1st support.
Pivot: 62.24
Supporting reasons: Identified as a pullback resistance that aligns with the 61.8% Fibonacci retracement, where selling pressures could intensify and potentially cap any upward retracement
1st support: 56.51
Supporting reasons: Identified as a swing low support, indicating a key level where the price could stabilize once more.
1st resistance: 65.75
Supporting reasons: Identified as an overlap resistance that aligns with the 61.8% Fibonacci retracement, indicating a potential area that could halt any further upward movement.
XAU/USD (GOLD):
Potential Direction: Bullish
Overall momentum of the chart: Bullish
The price could see a short-term pullback toward the pivot before rising again toward the 1st resistance.
Pivot: 4,244.72
Supporting reasons: Identified as a pullback support, where renewed buying pressure could emerge to push the price higher.
1st support: 4,041.68
Supporting reasons: Identified as a pullback support, indicating a key level where the price could stabilize once more.
1st resistance: 4,379.38
Supporting reasons: Identified as a swing resistance, indicating a potential area that could halt any further upward movement.

The accuracy, completeness and timeliness of the information contained on this site cannot be guaranteed. IC Markets Global does not warranty, guarantee or make any representations, or assume any liability regarding financial results based on the use of the information in the site.
News, views, opinions, recommendations and other information obtained from sources outside of www.icmarkets.com, used in this site are believed to be reliable, but we cannot guarantee their accuracy or completeness. All such information is subject to change at any time without notice. IC Markets Global assumes no responsibility for the content of any linked site.
The fact that such links may exist does not indicate approval or endorsement of any material contained on any linked site. IC Markets Global is not liable for any harm caused by the transmission, through accessing the services or information on this site, of a computer virus, or other computer code or programming device that might be used to access, delete, damage, disable, disrupt or otherwise impede in any manner, the operation of the site or of any user’s software, hardware, data or property.
The post Monday 15th December 2025: Technical Outlook and Review first appeared on IC Markets | Official Blog.
Monday 15th December 2025: Asian Markets Slide on Wall Street Tech Rout, Australia and Japan Lead Declines
424519 December 15, 2025 16:00 ICMarkets Market News
Global Markets:
- Asian Stock Markets : Nikkei down -1.56%, Shanghai Composite down -0.11%, Hang Seng down -0.99% ASX down -0.83%
- Commodities : Gold at $4,358.70 (0.70%), Silver at $62.850 (1.33%), Brent Oil at $61.42 (0.49%), WTI Oil at $57.55 (0.54%)
- Rates : US 10-year yield at 4.181, UK 10-year yield at 4.5180, Germany 10-year yield at 2.8611
News & Data:
- (CAD) Building Permits m/m 14.9% to -1.4% expected
Markets Update:
Asian stock markets are trading mostly lower on Monday, tracking broadly negative cues from Wall Street on Friday, where heavy selling in technology stocks weighed sharply on sentiment. Losses on the tech-heavy Nasdaq, driven by renewed concerns over stretched valuations and uncertainty around the interest-rate outlook, set a cautious tone across the region. Asian markets had closed mostly higher in the previous session.
In Australia, shares are notably lower, giving back part of Friday’s strong gains. The benchmark S&P/ASX 200 has slipped below the 8,650 level amid weakness in mining and energy stocks, reflecting softer commodity prices. Major miners and oil producers are mostly lower, while tech stocks are mixed. Gold miners are also under pressure, although the big banks are showing a mixed performance.
Japanese shares are trading sharply lower, reversing the previous session’s gains. The Nikkei 225 has fallen below 50,100, dragged down by declines in technology and exporter stocks, partly offset by modest gains in automakers and financials. Shares of SoftBank Group are among the biggest laggards, while select defensives and healthcare names are advancing.
Economic data showed Japan’s business sentiment improved slightly in the December quarter, according to the Tankan Survey released by the Bank of Japan.
Elsewhere in Asia, South Korea and Taiwan are down more than 1 percent, while most other regional markets are modestly lower. On Wall Street, all major averages ended lower on Friday, with technology stocks leading the decline. European markets also finished weaker, and crude oil prices eased, with U.S. dollar movements remaining firm against the yen.
Upcoming Events:
- 01:30 PM GMT – CAD CPI m/m
- 01:30 PM GMT – CAD Median CPI y/y
- 01:30 PM GMT – CAD Trimmed CPI y/y
The post Monday 15th December 2025: Asian Markets Slide on Wall Street Tech Rout, Australia and Japan Lead Declines first appeared on IC Markets | Official Blog.

Ex-Dividend 15/12/2025
424503 December 12, 2025 17:00 ICMarkets Market News
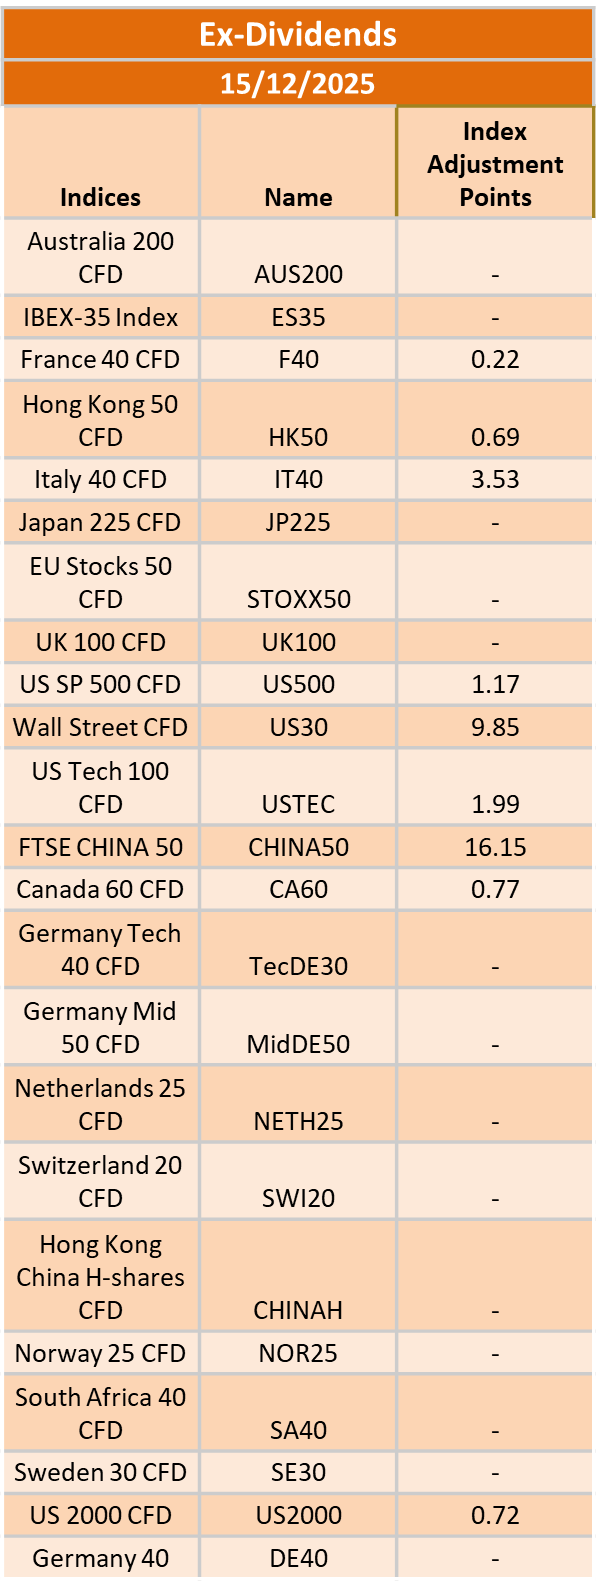
The post Ex-Dividend 15/12/2025 first appeared on IC Markets | Official Blog.
General Market Analysis – 12/12/25
424502 December 12, 2025 16:14 ICMarkets Market News
US Stocks Mixed After Fed – Dow up 1.3%
US equity markets were mixed overnight as investors continued to weigh the implications of the Fed’s latest rate cut. The Dow led the way, jumping 1.34% to finish at 48,704, while the S&P 500 managed a modest 0.21% rise to 6,901, both securing fresh record closes. The Nasdaq, however, slipped 0.25% to 23,593 after tech heavyweight Oracle issued a weaker-than-expected forecast, reigniting concerns that parts of the AI sector may be running ahead of fundamentals. In FX, the US dollar softened again, with the DXY easing 0.29% to 98.34, even as Treasury yields edged higher. The 2-year yield nudged up 0.3 bps to 3.541%, while the 10-year added 1 bp to 4.157%. Oil extended its recent decline, with Brent slipping 0.96% to $61.62 and WTI down 0.91% to $57.93, as markets drew optimism from renewed hopes for progress toward a Ukraine peace deal. Gold rallied strongly, climbing 1.06% to $4,278.85, supported by haven flows and momentum following yesterday’s Fed decision.
Investor Glasses Still Half Full for Christmas Drinks
Major US indices pushed higher in trading yesterday to hit fresh all-time high closes as investors continued to cheer the Fed’s interest rate cut on Wednesday and advice that we will see at least one more in 2026. The Dow and S&P hit records, while the Nasdaq fell marginally, which wasn’t a bad result given an 11% drop for Oracle. The market seems to be driving forward into the year-end with the same ‘glass half full’ mentality that has carried it to records in 2025, and investors are happy to jump on that bandwagon. However, there are some that fear a significant early-2026 hangover could be coming their way, with growth tech firms involved in AI looking to be the highest risk for some sharp corrections in the current environment – as we saw with Oracle yesterday. In addition to those fears, the Fed left plenty of wiggle room for hawks out there as well, despite the market’s initial reaction to Wednesday’s cut – so for now, investors are happy to eat, drink, and be merry while the good times last, but are wary that things can sometimes look different in the cold light of a fresh new day – or fresh new year!
Markets Strong into the Weekend
With the macro calendar far quieter today, traders may still see swings across markets as they continue to digest the heavy run of central bank updates and geopolitical developments from earlier in the week. The Asian session is expected to have a relatively quiet start to the day; however, with products trading at significant levels, traders are expecting things to liven up as the day progresses. The European session sees the release of the only tier 1 data of the day, with the UK GDP numbers due out. The month-on-month figure is expected to show just a 0.1% increase, and any deviation from this will see big moves in the pound, anything lower likely to put more pressure on the Bank of England ahead of next week’s interest rate call. There is little on the calendar in the New York session today, which should see smoother trading conditions; however, as above, with indices at all-time highs and the Fed update still fresh in investors’ minds, most traders are expecting another lively session.
The post General Market Analysis – 12/12/25 first appeared on IC Markets | Official Blog.