Articles
New York Fed survey sees rising one-year consumer inflation expectations, jobs angst
January 8, 2026 23:14 Forexlive Latest News Market News
- One year inflation expectations +3.4% vs +3.2%
- Three-year inflation unchanged at 3.0%
- Five year inflation unchanged at 3.0%
- Job-finding expectations hit record low
- Expectations of home price growth unchanged at 3%
- Perception of credit access fell
- Expectations of losing a job rose
- Median one-year-ahead earnings growth expectations remained unchanged at 2.6% in November
- The mean perceived probability that U.S. stock prices will be higher 12
months from now increased by 0.1 percentage point to 38.0%.
From the survey:
Perceptions about
households’ current financial situations deteriorated notably, with a
larger share of respondents reporting that their households were worse
off compared to a year ago and a smaller share reporting they were
better off. Expectations about year-ahead financial situations also
deteriorated slightly, with a smaller share of respondents reporting
that their households are expecting to be better off a year from now.
Mean unemployment
expectations—or the mean probability that the U.S. unemployment rate
will be higher one year from now—improved slightly, decreasing by
0.4 percentage point to 42.1 percent.
The mean perceived probability of losing one’s job in the next 12
months increased by 1.4 percentage points to 15.2%. The reading is
above the series’ 12-month trailing average of 14.3%. The increase was
broad-based across age and education groups. The mean probability of
leaving one’s job voluntarily, or the expected quit rate, in the next
12 months decreased by 0.2 percentage point to 17.5%.
That last one is the most worrisome but it should speak to lower wage demand as well, something that should allow the Fed to cut rates more deeply. Along those lines, “Median one-year-ahead earnings growth expectations decreased by 0.1
percentage point to 2.5% in December, remaining below its 12-month
trailing average of 2.7%. The series has been moving within the 2.4% to
3.0% range since May 2021.”
This article was written by Adam Button at investinglive.com.
US October wholesale inventories +0.2% vs +0.2% expected
January 8, 2026 22:14 Forexlive Latest News Market News
- Prior was +0.5%
- Wholesale trade sales -0.4% vs -0.2% exp
It’s not clear whether we will get the Atlanta Fed GDPNow tracker but there should be a big rise in the Q4 data due to strong trade numbers earlier. This reading will be a small drag but it was mostly priced in.
The US wholesale inventories report is a monthly economic indicator published by the US Census Bureau that measures the dollar value of goods held by merchant wholesalers at the end of each month. These firms operate between manufacturers and retailers, selling goods to businesses, institutions, and other wholesalers. The data are drawn from the Monthly Wholesale Trade Survey and include inventory levels, monthly sales, and the inventories-to-sales ratio.
Wholesale inventories are closely watched because they provide insight into supply-chain conditions and demand expectations. Rising inventories can reflect confidence in future sales and intentional stock-building, but they can also signal slowing demand if goods are accumulating unsold. Falling inventories may indicate strong sales, cautious ordering, or deliberate destocking. As a result, the report is often interpreted alongside retail sales and manufacturing data to gauge broader economic momentum.
The report plays a direct role in GDP through the change in private inventories component. GDP measures production, not final sales, so goods that are produced but placed into inventory add to GDP in the period they are made. Conversely, inventory drawdowns subtract from GDP even if end demand is strong. Wholesale inventories therefore can meaningfully boost or drag quarterly GDP growth, sometimes obscuring the underlying demand trend.
Markets also focus on the inventories-to-sales ratio, which helps assess whether inventory levels are sustainable or likely to lead to future production adjustments.
This article was written by Adam Button at investinglive.com.
US posts smallest trade deficit since 2009
January 8, 2026 20:39 Forexlive Latest News Market News
- Prior was a deficit of $52.8B (revised to -48.1B)
- Goods trade balance -58.57B vs -77.69B prior
You will see some big Q3 GDP forecast upgrades with this data.
We also got the Q3 US productivity report and it was a big beat with productivity up 4.9% compared to 3.0% expected. The prior quarter was also revised to 4.1% from 2.4%. Unit labor costs fell 1.9% compared to +1.0% expected.
Canadian trade balance for October:
- Balance -0.58B vs -1.36B expected
- Exports 65.61B vs 64.23B prior
- Imports 66.19B vs 64.08B prior
These numbers were both badly delayed by the US government shutdown.
This article was written by Adam Button at investinglive.com.
US initial jobless claims 208K versus 210K estimate.
January 8, 2026 20:39 Forexlive Latest News Market News
Initial Jobless Claims (week ending Jan 3)
-
Initial claims: 208K, +8K vs last week (prior week revised up to 200K)
-
Weekly revision: Last week revised +1K (199K → 200K)
-
4-week moving average: 211.8K, -7.3K vs prior week
-
Notable: Lowest 4-week average since April 27, 2024, reinforcing underlying labor-market firmness
Continuing Jobless Claims (week ending Dec 27)
-
Continuing claims: 1.914M, +56K vs last week (prior week revised down to 1.858M)
-
Weekly revision: Last week revised -8K (1.866M → 1.858M)
-
Insured unemployment rate: 1.2%, unchanged vs last week
-
4-week moving average: 1.893M, +21K vs prior week
-
Trend: Gradual upward drift in continuing claims, but no sign of sharp labor-market deterioration
Bottom-line takeaway
-
Initial claims remain low and stable, with the 4-week average falling to cycle lows, signaling limited new layoffs.
-
Continuing claims are edging higher, suggesting slightly longer unemployment durations, but levels remain historically contained—consistent with a cooling, not cracking, labor market.
Initial jobless claims track the weekly number of Americans filing for unemployment benefits for the first time and are one of the most timely indicators of U.S. labor-market health and overall economic momentum. Rising claims can signal increasing job losses and a slowing economy, while declining claims suggest that hiring is outpacing layoffs, pointing to underlying economic strength. Released every Thursday by the U.S. Department of Labor, the report is closely watched by economists and markets alike, with particular emphasis on the four-week moving average, which helps smooth out weekly volatility and provides a clearer view of underlying labor-market trends.
This article was written by Greg Michalowski at investinglive.com.
investingLive European market wrap: Dollar steady, precious metals drop; NFP eyed tomorrow
January 8, 2026 20:00 Forexlive Latest News Market News
Headlines:
- An early test for gold and silver ahead of the main event tomorrow
- US non-farm payrolls distortion to carry over to December report tomorrow?
- USDJPY remains confined in a range: traders eye US NFP tomorrow for key breakouts
- Trump says that US oversight of Venezuela could stay on for years
- Nvidia to require full upfront payment from Chinese clients for H200 chips – report
- US job cuts fall to 17-month low to round off the final month of 2025
- Switzerland December CPI +0.1% vs +0.1% y/y expected
- Eurozone November PPI +0.5% vs +0.2% m/m expected
- Germany November industrial orders +5.6% vs -1.0% m/m expected
- UK December Halifax house prices -0.6% vs +0.2% m/m expected
- Chinese yuan bets looking more favoured as we get into the new year
Markets:
- USD steady, AUD and NZD lag on the day
- European equities lower; S&P 500 futures down 0.2%
- US 10-year yields up 2.3 bps to 4.161%
- Gold down 0.7% to $4,422.59
- WTI crude oil up 1.4% to $56.81
- Bitcoin down 1.5% to $89,700
As the market focus turns towards the US labour market report tomorrow, traders are taking some caution and a bit of a breather from the early moves to start the year. Equities were more tepid after the drop in Wall Street yesterday while precious metals continue to pull back as bets are taken off the table before the main event on Friday.
In FX, the dollar is keeping steadier and mostly little changed across the board. EUR/USD lacked appetite in a 13-pip trading range and is keeping flat at 1.1673 on the day. USD/JPY also barely budged as it is keeping flattish at 156.67 at the moment. The only notable movers were the antipodes with AUD/USD down 0.4% to 0.6695 and NZD/USD down 0.4% to 0.5745 amid the more sluggish risk mood.
European indices are keeping a little lower with the DAX also now turning negative after a more hopeful start. The German benchmark index pushed for record highs again but the momentum eventually fizzled with US futures also keeping slightly lower at the balance. S&P 500 futures are down 0.2% with Nasdaq futures down 0.3% on the day.
Trump touting that the US could stay in Venezuela for years and Nvidia continuing to tussle with Beijing are two notable headlines we got during the session. That apart from US layoffs easing in December but the 2025 picture marks the worst year in terms of job cuts since the Covid pandemic.
Meanwhile, precious metals continue to be in the spotlight with gold and silver running lower and dropping to test key near-term levels as highlighted in the linked post. It’s an early test before we get to the US labour market report tomorrow with a potential pullback on the cards.
Gold dipped to a low of $4,408 in the past hour before a light bounce to $4,422 with silver just hovering off its lows and down nearly 4% to $75.07 currently. Danger, danger. When something becomes too heavy of a consensus, just be wary that pullbacks can be sharp and volatile.
This article was written by Justin Low at investinglive.com.
US non-farm payrolls distortion to carry over to December report tomorrow?
January 8, 2026 19:14 Forexlive Latest News Market News
As a reminder, we are moving back to the regular scheduled programming in which the US non-farm payrolls data is released on the first real Friday of the month. The November report was plagued by data quality issues amid the longest US government shutdown, which eventually saw the report delayed to the middle of December.
So as we look towards the December report tomorrow, what are some things to watch out for?
For one, keep a close watch on the household survey response rate. This is one that’s already following a declining trend over the last two decades but the November report featured a sharp decline to the lowest response rate on record. The 64% reading is a steep drop from the 68.9% recorded in September (remember, the October report was skipped).
The BLS pointed to this and composite weighting changes in arguing that the “national unemployment rate standard error was going to be larger
than usual by a factor of 1.06” just a day before the November report.
Given that things should be “back to normal” this time around, we should see an improvement in the household survey response rate as well as any other technical issues from the prior report. However, it is worth keeping an eye out just in case these complications continue to appear in the December report.
Besides that, there are some other things to watch out for in potentially affecting the employment picture. JP Morgan notes that:
“Despite the government shutdown ending partway through the household survey
reference week, a number of federal employees still classified themselves as being on temporary layoff.
Reversing that in December could cut the unemployment rate about 4bp.”
So, that is another thing to be aware of as the unemployment rate will come under heavy scrutiny after the jump to 4.56% in November. The consensus is for a marginal improvement in the jobless rate in December to 4.5% (rounded) but the broader trend remains clear. And that is unemployment continuing to pick up as the labour market picture softens. So, I would argue that risks are tilted to the higher side here and that is a key risk factor that could impact the Fed outlook; especially if we get a reading closer to 4.7% (rounded).
Then, there’s a fresh driver in affecting the December report that should have been absent in November. That being the weather itself. Colder than usual temperatures observed around the payrolls reference period in December could play a small role in impacting the numbers, though this is usually more evident in January and February.
In tying everything together, just be mindful that just because we have seemingly returned to the normal schedule, it doesn’t mean that all the kinks have been necessarily ironed out in the numbers just yet.
This article was written by Justin Low at investinglive.com.
Trade USDJPY on the Non-Farm Payroll Data Release
January 8, 2026 18:14 ICMarkets Market News
FX Traders are eagerly anticipating the release of key US employment data on the first Friday of the year this week. Most are happy that we are back to normal procedure with the Non-Farm Payrolls being released as usual on a Friday after a few months of disruption due to the US government shutdown last year. This data set has the propensity to move markets even more strongly this time out, as there will be a lot more faith in the data as the Bureau of Labour Statistics is back to normal running and markets are acknowledging the importance that the FOMC is giving to the jobs market.
The market is expecting that the headline Non-Farm Employment Change number will show an increase of around 60k with the Average Hourly Earnings data set to show a month-on-month increase of 0.3% – up from 0.1% last time out. Last months surprise was the Unemployment Rate pushing higher to 4.6%, but it is expected to drop back to 4.5% this month. Traders are expecting that any deviation of +/- 20k for the headline figure and a 0.1% change from the Unemployment Rate will see sharp moves in the market.
USDJPY is shaping up for one of the best trading opportunities on the data as it is sitting on key technical levels that should see exacerbated moves on the data release. It is currently sitting close to strong trendline support on the daily chart and any weaker data should see a clean break and open the way for a move back towards December lows and the next support levels under 154.00. Stronger numbers would see the dollar appreciate and should see the pair swiftly challenge the resistance trendline around 157.60 with a break there likely to see a longer-term target up near 160.00.
Resistance 2: 161.99 – July 2024 High
Resistance 1: 157.65 – Trendline Resistance
Support 1: 156.44 – Trendline Support
Support 2: 153.60 – Long-Term Trendline Support

The accuracy, completeness and timeliness of the information contained on this site cannot be guaranteed. IC Markets Global does not warranty, guarantee or make any representations, or assume any liability regarding financial results based on the use of the information in the site.
News, views, opinions, recommendations and other information obtained from sources outside of www.icmarkets.com, used in this site are believed to be reliable, but we cannot guarantee their accuracy or completeness. All such information is subject to change at any time without notice. IC Markets Global assumes no responsibility for the content of any linked site.
The fact that such links may exist does not indicate approval or endorsement of any material contained on any linked site. IC Markets Global is not liable for any harm caused by the transmission, through accessing the services or information on this site, of a computer virus, or other computer code or programming device that might be used to access, delete, damage, disable, disrupt or otherwise impede in any manner, the operation of the site or of any user’s software, hardware, data or property.
The post Trade USDJPY on the Non-Farm Payroll Data Release first appeared on IC Markets | Official Blog.
Ex-Dividend 09/01/2026
January 8, 2026 18:00 ICMarkets Market News
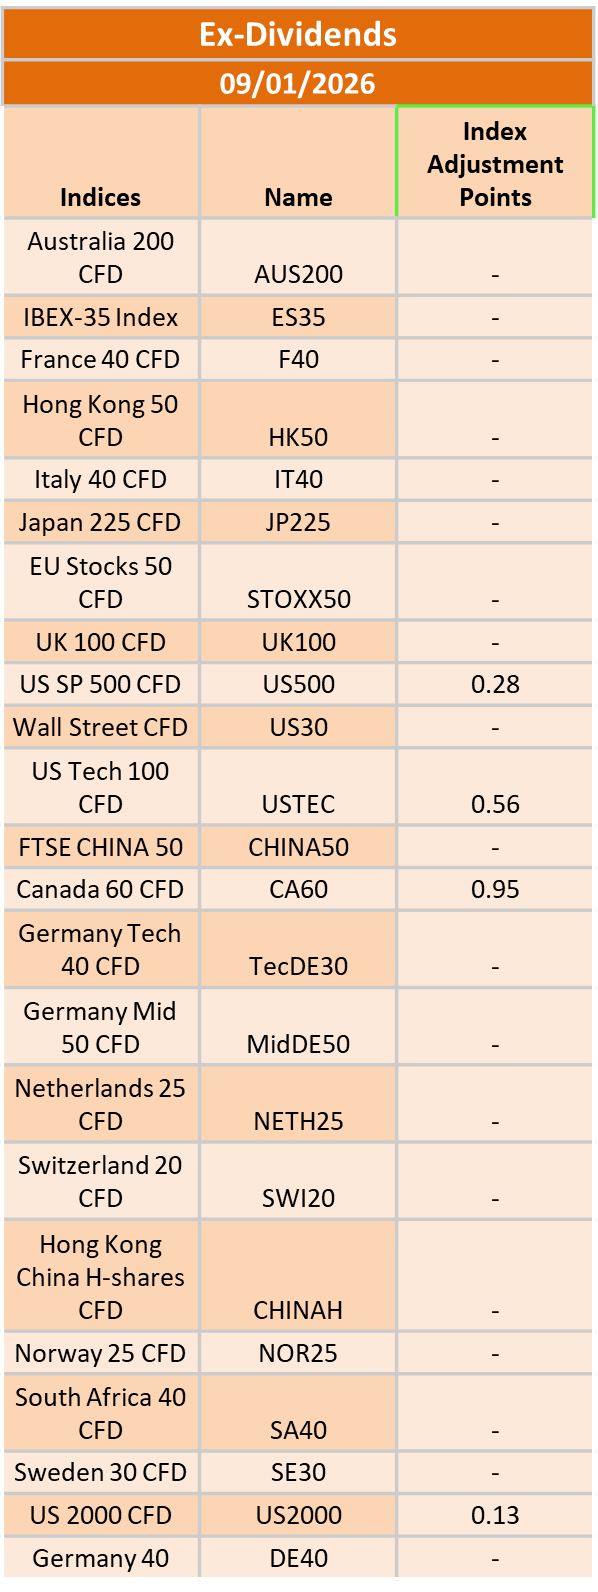
The post Ex-Dividend 09/01/2026 first appeared on IC Markets | Official Blog.
Eurozone November PPI +0.5% vs +0.2% m/m expected
January 8, 2026 17:14 Forexlive Latest News Market News
- Prior +0.1%
- PPI -1.7% vs -1.9% y/y expected
- Prior -0.5%
It’s a beat on estimates but this is very much a lagging data point at best. The consumer price index (CPI) precedes this and outweighs this on inflation trends, so just take this as a supportive or secondary data. If excluding energy, producer prices were only up 0.1% on the month in November last year.
The breakdown shows that prices for:
- Intermediate goods +0.3%
- Energy +1.8%
- Capital goods +0.1%
- Durable consumer goods +0.3%
- Non-durable consumer goods -0.2%
And when compared to the same month a year ago, producer prices were seen down 1.7%. However, much of that owes to a steep decline in energy prices (-7.4%). All other categories show an increase compared to the corresponding month one year ago, with total producer prices actually up 1.0% once you strip out energy.
This article was written by Justin Low at investinglive.com.
US job cuts fall to 17-month low to round off the final month of 2025
January 8, 2026 17:00 Forexlive Latest News Market News
It seems like Challenger published the report early again with job cuts in December 2025 totaling to 35,553, down 50% from the 71,321 layoffs announced in November. Compared to the previous December in 2024 (38,792), job cuts were down 8%.
The total for December last year is the lowest monthly total since 25,885 cuts were announced in July 2024 and the lowest December total since 2023. It is only the fourth time in 2025 that job cuts were lower than the corresponding month in the one year before that.
Looking as a whole, 2025 job cuts amounted to 1,206,374. That is the highest yearly total since 2020 i.e. the Covid pandemic year and the seventh highest annual total since 1989. The total is only behind the years 2001, 2002, 2003, 2008, 2009, and 2020 itself.
The breakdown for the year shows that the government sector led job cuts across all industries with 308,167 layoffs announced. All of that is primarily tied to the federal government with this being up 703% from the 38,375 job cuts in 2024. Much of that came in Q1 though amid Elon Musk’s DOGE initiative, with the total in the first quarter being 279,445 job cuts. The subsequent nine months only totaled to 28,722 job cuts.
In the private sector, it was tech that led job cuts last year with 154,445 layoffs announced. That is up 15% from the 133,988 job cuts in this sector in 2024. Challenger notes that:
“Technology has been pivoting to both developing and implementing artificial intelligence much more
quickly than any other industry. This coupled with over-hiring over the last decade created a wave of
job loss in the industry.”
The full report can be found here.
This article was written by Justin Low at investinglive.com.
IC Markets Global – Asia Fundamental Forecast | 07 January 2026
January 8, 2026 15:39 ICMarkets Market News
IC Markets Global – Asia Fundamental Forecast | 07 January 2026
What happened in the U.S. session?
Overnight in the U.S. session, risk appetite stayed firm with U.S. equities edging higher toward record levels, Treasury yields ticking up slightly, and the dollar broadly steady as traders positioned for key inflation and labor data later in the week. The main scheduled macro release was the U.S. services PMI, which showed ongoing expansion but at a slower pace, tempering some of the recent growth optimism.
What does it mean for the Asia Session?
Asian traders will focus on a cluster of key macro releases that could drive volatility in AUD, EUR, USD, and CAD pairs in the Asian and early European sessions. Australia prints its monthly CPI figures (headline m/m and y/y plus trimmed mean m/m), which will heavily influence expectations for the Reserve Bank of Australia and thus AUD crosses at the start of the day. Later in the European morning, the eurozone releases its Core CPI and headline CPI flash estimates year‑on‑year, critical for gauging the European Central Bank’s policy path and likely to affect EUR/JPY and EUR/AUD.
The Dollar Index (DXY)
Key news events today
ADP Non-Farm Employment Change (1:15 pm GMT)
ISM Services PMI (3:00 pm GMT)
JOLTS Job Openings (3:00 pm GMT)
What can we expect from DXY today?
The U.S. dollar enters Monday of the week containing 7 January 2026 on a slightly firmer footing, with the dollar index edging up into the high‑98s after suffering its steepest annual decline in about eight years in 2025. However, market commentary still characterizes the move as a modest rebound within a broader bearish trend, as investors anticipate Federal Reserve rate cuts, remain wary of U.S. fiscal and political risks, and look ahead to key U.S. data releases that could either reinforce or challenge the prevailing bias to sell the dollar on rallies.
Central Bank Notes:
- The Federal Open Market Committee (FOMC) is widely expected to lower the federal funds rate target range by 25 basis points to 3.50%–3.75% at its December 9–10, 2025, meeting, marking the third consecutive cut after the October reduction to 3.75%–4.00%
- The Committee continues to pursue maximum employment and 2% inflation goals, with the labor market showing further softening as the unemployment rate rose to 4.4% in September 2025 amid modest job gains.
- Officials note persistent downside risks to growth alongside resilient activity, with inflation easing to 3.0% year-over-year CPI in September but remaining elevated due to tariff effects; core PCE stands at around 2.8% as of October.
- Economic activity grew at a 3.8% annualized pace in Q2 2025 per revised estimates, though Q3 and Q4 face headwinds from trade tensions, fiscal restraint, and data disruptions like the government shutdown.
- September’s Summary of Economic Projections forecasts 2025 unemployment at a median of 4.5%, with PCE inflation near 3.0% and core PCE at 3.1%, signaling a gradual disinflation path. Updates expected on December 10 may adjust for higher unemployment and lower growth.
- The Committee maintained its data-dependent approach, noting a softening labor market and inflation above the 2% target, while deciding to lower the federal funds rate target range by 25 basis points to 3.50%-3.75%. Dissent persisted, with multiple members opposing the cut or advocating for a hold, reflecting divisions similar to recent meetings.
- The FOMC confirmed the conclusion of its quantitative tightening program effective December 1, 2025, with Treasury rolloff caps at $5 billion per month and agency MBS caps at $35 billion per month to ensure ample reserves and market stability.
- The next meeting is scheduled for 27 to 28 January 2026.
Next 24 Hours Bias
Medium Bearish
Gold (XAU)
Key news events today
ADP Non-Farm Employment Change (1:15 pm GMT)
ISM Services PMI (3:00 pm GMT)
JOLTS Job Openings (3:00 pm GMT)
What can we expect from Gold today?
Gold remains near the very strong levels it reached at the end of last week, holding close to early‑2026 highs after an exceptional 2025 rally driven by safe‑haven demand, expectations of lower US interest rates, and broad macroeconomic uncertainty. Price action around the start of this week shows gold consolidating after its surge, with analysts describing a still‑bullish but potentially moderating trend for January as traders weigh possible central‑bank rate cuts, elevated global debt, and geopolitical risks against the risk of short‑term pullbacks or profit‑taking.
Next 24 Hours Bias
Strong Bullish
The Australian Dollar (AUD)
Key news events today
CPI m/m (12:30 am GMT)
CPI y/y (12:30 am GMT)
Trimmed Mean CPI m/m (12:30 am GMT)
What can we expect from AUD today?
The Australian dollar starts the week trading near recent highs against the US dollar after an 8% rise in 2025, underpinned by a hawkish Reserve Bank of Australia stance, firm domestic inflation, and expectations that Australian rates may rise while US rates fall. Markets are watching upcoming Australian inflation data and the late‑January CPI report, which could shape a potential RBA move at its early‑February meeting, while softer iron ore prices and uncertainty over China’s economy act as counterweights that may limit further gains.
Central Bank Notes:
- The Reserve Bank of Australia held its cash rate steady at 3.60% at the November 2025 policy meeting, adopting a cautious tone amid a surprise uptick in inflation data for the September quarter. This marks the fourth consecutive pause since the 25 basis point cut in August. The Board attributed some of the inflation rise to temporary factors like higher petrol prices and council rates, but noted signs of more persistent pressures from consumer demand.
- Policymakers emphasized vigilance on inflation, with trimmed mean inflation expected to remain elevated in the near term before nearing the 2–3% target midpoint by mid-2027. Recent data showed underlying inflation staying above target until at least the second half of 2026, prompting upward revisions to forecasts. Capacity pressures are seen as slightly more pronounced than previously assessed, delaying any easing.
- Headline CPI for the September quarter exceeded expectations, driven partly by temporary items, while underlying measures signal ongoing stickiness. The shift to monthly CPI reporting, with the first full edition in November 2025, will enhance real-time inflation monitoring. Housing and services remain resilient contributors to price pressures.
- Domestic demand shows firmness in services alongside below-trend growth elsewhere, with capacity pressures not expected to ease significantly. The labor market is gradually softening, with unemployment projected to stabilize around 4.4%, though wage growth and productivity dynamics keep unit labor costs a concern. Household spending faces headwinds from high borrowing costs.
- Global risks include geopolitical tensions and commodity volatility, set against modestly revised-up world growth outlooks. The Board describes its policy as mildly restrictive and data-dependent, balancing inflation control with employment goals. No rate hike was considered despite the inflation surprise.
- Monetary policy remains mildly restrictive to address lingering price stability risks amid household and global vulnerabilities. Communications reaffirm the dual mandate of 2–3% inflation and full employment, with readiness to adjust based on incoming data.
- Market expectations point to the cash rate holding through early 2026, with a possible modest cut to 3.3% mid-year if inflation eases as forecast. The new monthly CPI data will be key for timely insights.
- Monetary policy remains mildly restrictive, balancing progress on price stability against vulnerabilities in household demand and global outlook. Board communications reaffirm a dual mandate: price stability and full employment, while underscoring readiness to respond should risks materialize sharply.
- Analysts generally expect the cash rate to remain at current levels through early 2026, with only modest cuts possible later in the year if inflation moderates. The new monthly CPI release (first full edition Nov 2025) will be watched closely for timely signals on price trends.
- The next meeting is on 2 to 3 February 2026.
Next 24 Hours Bias
Medium Bullish
The Kiwi Dollar (NZD)
Key news events today
No major news event
What can we expect from NZD today?
The New Zealand dollar is trading slightly stronger in early-week activity, supported by improved global risk sentiment and a softer US dollar, with NZD/USD hovering around the 0.58 level after several sessions of gradual gains. The currency’s move is being driven more by external factors, particularly expectations of further US Federal Reserve rate cuts in 2026, than by any fresh domestic New Zealand data today, and markets remain attentive to incoming US economic releases and Fed commentary that could shift the interest-rate differential.
Central Bank Notes:
- The Monetary Policy Committee (MPC) left the Official Cash Rate (OCR) unchanged at 2.25% at its 26 November 2025 meeting, following the widely anticipated 25-basis-point reduction from 2.50%, and signaled that policy is now firmly in stimulatory territory while keeping the option of further easing on the table if needed.
- The decision was again reached by consensus, with members judging that the cumulative 325 basis points of easing over the past year warranted a period of assessment, even as several emphasized a willingness to cut further should incoming data point to a more protracted downturn or renewed disinflationary pressures.
- Headline consumer price inflation is projected to hover near 3% in late 2025 before gradually easing toward the 2% midpoint of the 1–3% target band through 2026, supported by contained inflation expectations around 2.3% over the two-year horizon and an expected pickup in spare capacity.
- The MPC noted that domestic demand remains subdued but shows tentative signs of stabilisation, with softer household spending and construction only partially offset by improving services activity; nevertheless, policymakers still expect services inflation to ease as wage growth moderates and the labour market loosens further over the coming year.
- Financial conditions continue to ease as wholesale and retail borrowing rates reprice to the lower OCR, contributing to gradually rising mortgage approvals and improving housing-related sentiment, although broader business credit growth remains patchy and sensitive to uncertainty about the durability of the recovery.
- Recent data confirm that GDP momentum is weak but not deteriorating as sharply as earlier in 2025, with high-frequency indicators pointing to a shallow recovery from a low base and ongoing headwinds from elevated living costs and fragile confidence weighing on discretionary consumption and investment.
- The MPC reiterated that external risks remain skewed to the downside, particularly from softer Chinese demand and uncertainty around United States trade policy, but noted that a lower New Zealand dollar continues to provide some offset via improved export competitiveness and support for tradables inflation.
- Looking ahead to early 2026, the Committee maintained a mild easing bias, indicating that a further cut toward 2.00–2.10% cannot be ruled out if activity fails to gain traction or if inflation undershoots projections, but current forecasts envisage the OCR remaining near 2.25% for an extended period provided inflation converges toward target and the recovery proceeds broadly as expected.
- The next meeting is on 18 February 2026.
Next 24 Hours Bias
Medium Bearish
The Japanese Yen (JPY)
Key news events today
No major news event
What can we expect from JPY today?
Today, the Japanese yen remains under pressure, trading around the mid‑156 to 157 per dollar area near ten‑month lows, as wide rate gaps with the US and uncertainty about the pace of Bank of Japan hikes weigh on the currency. Market participants are closely monitoring upcoming Japanese PMI and inflation data, along with shifts in US Federal Reserve cut expectations, to gauge whether USD/JPY can push again toward the 158–160 region or retreat on renewed intervention fears and stronger BoJ tightening bets.
Central Bank Notes:
- The Policy Board of the Bank of Japan will meet on 18–19 December with markets almost fully pricing a 25-basis-point hike, which would raise the short-term policy rate from 0.50% to around 0.75%, as the bank moves further away from its ultra-loose stance while stressing that any tightening will remain gradual and data-dependent.
- The BOJ is expected to continue guiding the uncollateralized overnight call rate in a narrow band around the new policy rate, near 0.75%, while signaling that the pace and timing of any additional hikes will depend on how past increases affect bank lending, corporate financing conditions, and overall economic activity.
- The quarterly path of JGB purchases remains on a pre-announced, gradual taper: outright purchases are being reduced by about ¥400 billion per quarter through March 2026, then by roughly ¥200 billion per quarter from April to June 2026, with the bank still aiming for JGB purchases to settle near ¥2 trillion in Q1 2027 and retaining flexibility to adjust the pace if market functioning or yield volatility deteriorate.
- Japan’s economy has softened in the near term, with Q3 2025 GDP contracting at an annualized rate of approximately 2.3%, as weaker residential investment and external demand weighed on activity. Meanwhile, business sentiment in manufacturing has recently improved to a roughly four-year high.
- Core consumer inflation (excluding fresh food) accelerated to around 3.0% year-on-year in October, up from 2.9% in September and remaining above the BOJ’s 2% target, while the “core-core” measure excluding both fresh food and energy rose to about 3.1%, underscoring persistent underlying price pressures.
- In the very near term, some input-cost pressures are easing as earlier import price surges fade, but services inflation linked to labor shortages, along with steady wage gains, continues to support broader price momentum; firms’ and households’ medium-term inflation expectations remain anchored slightly above 2%, keeping short-term inflation risks tilted to the upside.
- For the coming quarters, the BOJ assesses that real growth will likely run below potential as the economy digests tighter financial conditions and past yen depreciation. However, accommodative real rates, positive real wage growth, and improving corporate sentiment are expected to help sustain a modest recovery in private consumption and business investment.
- Over the medium term, as overseas demand stabilizes and domestic labor markets remain tight, the BOJ expects wage settlements and inflation expectations to keep core inflation on a gradual upward trajectory around or slightly above 2%, providing room for further cautious rate normalization as long as financial conditions remain supportive and the recovery is not derailed.
- The next meeting is scheduled for 22 to 23 January 2026.
Next 24 Hours Bias
Strong Bearish
Oil
Key news events today
EIA Crude Oil Inventories (2:30 pm GMT)
What can we expect from Oil today?
Oil prices are trading weakly, with the market focused on oversupply risks, steady OPEC+ output, and geopolitical events such as the Venezuela crisis and ongoing tensions in the Middle East. Analysts generally see a bearish to mildly stabilizing outlook for early January as rising global supply and cautious demand keep both Brent and WTI under downside pressure despite periodic geopolitical spikes.
Next 24 Hours Bias
Medium Bearish
The post IC Markets Global – Asia Fundamental Forecast | 07 January 2026 first appeared on IC Markets | Official Blog.
Wednesday 7th January 2026: Asian Markets Trade Mixed as Investors Weigh Geopolitical Risks and Key U.S. Data
January 8, 2026 15:15 ICMarkets Market News
Global Markets:
- Asian Stock Markets : Nikkei down 0.63%, Shanghai Composite up 0.29%, Hang Seng down 1.05% ASX up 0.38%
- Commodities : Gold at $4,487.35 (-0.19%), Silver at $80.507 (-0.65%), Brent Oil at $60.07 (-1.02%), WTI Oil at $56.32 (-1.42%)
- Rates : US 10-year yield at 4.162, UK 10-year yield at 4.4820, Germany 10-year yield at 2.8466
News & Data:
- (USD) Final Services PMI 52.5 to 52.9 expected
Markets Update:
Asian stock markets traded mixed on Wednesday, taking broadly positive cues from Wall Street overnight but remaining cautious amid rising geopolitical tensions between the U.S. and Venezuela, as well as escalating strains between China and Japan over Taiwan. Investors are also awaiting several key U.S. economic reports due later this week. Asian markets had closed mostly higher on Tuesday.
Attention is focused on Friday’s U.S. monthly jobs report, which could shape expectations for interest rates ahead of the Federal Reserve’s policy meeting later this month. While the Fed is widely expected to keep rates unchanged at its January meeting, markets continue to price in at least one quarter-point rate cut in the coming months.
Australian shares rebounded strongly, with the S&P/ASX 200 climbing above 8,700, supported by gains in gold miners and technology stocks, despite weakness in energy and financial shares. Major miners BHP Group and Rio Tinto advanced, while oil stocks declined. Technology shares were mostly higher, and gold miners posted solid gains. Several individual stocks surged on contract wins, patent approvals, and upbeat results.
In economic data, Australia’s annual inflation eased to 3.4 percent in November, its lowest level since August, while building permits rose sharply, beating expectations. The Australian dollar traded around $0.673.
Japan’s stock market declined, reversing gains from earlier sessions, led by losses in exporters and technology stocks. Economic data showed Japan’s services sector continued to expand in December, though at a slower pace.
Elsewhere in Asia, markets were mixed, while Wall Street and major European indices closed higher overnight. Crude oil prices fell as investors assessed the impact of recent U.S. military action in Venezuela.
Upcoming Events:
- 03:00 PM GMT – USD ISM Services PMI
- 03:00 PM GMT – USD JOLTS Job Openings
The post Wednesday 7th January 2026: Asian Markets Trade Mixed as Investors Weigh Geopolitical Risks and Key U.S. Data first appeared on IC Markets | Official Blog.