Articles
Italy November final CPI +1.1% vs +1.2% y/y prelim
December 16, 2025 16:14 Forexlive Latest News Market News
- Prior 1.2%
- HICP +1.1% vs +1.1% y/y prelim
- Prior +1.3%
Slight delay in the release by the source. Core annual inflation is seen slowing down from 1.9% to 1.7% in November, so that’s something to at least take note of. That said, the sticking point for inflation for the ECB is still very much the German economy at this point. So, that’s going to continue to keep them boxed in the current position of not moving on rates.
As things stand, traders are not anticipating any major moves by the ECB even through to next year. That being said, things can still change depending on data developments in the months ahead. But for now, the outlook seems to be clear that the ECB won’t be afforded much room to make another move in terms of rate cuts. And policymakers are also of the same view with markets at the very least, even if they would like some added flexibility as an option.
EUR/USD trades at 1.1753 currently, having little to do on the day amid a more mixed PMI showing with little to offer before we get to the slew of US data later. Large option expiries at 1.1750 will continue to keep things in check, acting as a magnet for price action in European trading at least.
This article was written by Justin Low at investinglive.com.
Eurozone December flash services PMI 52.6 vs 53.3 expected
December 16, 2025 16:14 Forexlive Latest News Market News
- Prior 53.6
- Manufacturing PMI 49.2 vs 49.9 expected
- Prior 49.6
- Composite PMI 51.9 vs 52.7 expected
- Prior 52.8
After the downcast from the German numbers, this was well expected. Both the services and manufacturing prints are softer than estimated, pushing down overall activity in the euro area for December. That said, it still marks another expansion in activity at least to wrap up the year. That won’t change much for the ECB outlook as such. EUR/USD continues to trade near unchanged on the day at 1.1752 with large option expiries seen at 1.1750. HCOB notes that:
“Economic growth slowed at the end of the year due to a slight contraction in the manufacturing sector and weaker
momentum in the service sector. The weaker performance is primarily attributable to German industry, where the downturn
intensified. In France, on the other hand, there are signs of a cautious recovery in industry, although a single monthly figure
should not be overrated. However, the service sector, which had expanded last month, is stagnating there, while Germany’s
service companies saw another solid rise in activity. All in all, the runway into the new year seems pretty unstable.
“Despite a softening of growth, the service sector continues to look relatively robust. Companies have no reason to complain
about new business and are therefore hiring additional staff. Looking ahead, however, companies have become somewhat
more cautious, which is likely due in part to the decline in order backlogs. We expect the service sector to continue to play a
stabilising role for the economy as a whole in the coming year. However, a real upturn will only succeed if the manufacturing
sector regains its footing.
“Cost inflation in the service sector reached its highest rate in nine months in December. The European Central Bank, which
is meeting on December 18 and is monitoring service inflation particularly closely, is likely to see its publicly stated policy of
leaving interest rates unchanged confirmed. It is clear that price pressure, driven in part by wage increases, is still
noticeable.”
This article was written by Justin Low at investinglive.com.
Germany December flash manufacturing PMI 47.7 vs 48.5 expected
December 16, 2025 15:39 Forexlive Latest News Market News
- Prior 48.2
- Services PMI 52.6 vs 53.0 expected
- Prior 53.1
- Composite PMI 51.5 vs 52.4 expected
- Prior 52.4
This is in contrast to the better than expected French PMIs. In fact, the gains seen in the euro following the French release got erased. Overall, this doesn’t change anything for the ECB though. The central bank will likely maintain its neutral stance and keep monitoring economic developments.
Comment:
Commenting on the flash PMI data, Dr. Cyrus de la Rubia, Chief Economist at Hamburg Commercial Bank, said:
“What a mess, one might exclaim in view of the further downturn in the manufacturing sector. For the second month in a
row, the headline manufacturing PMI has fallen deeper into sub-50 contraction territory, and for the first time in ten months,
production is also declining. The latter comes as no surprise, as order intakes had already slumped in November. This trend
has now continued, which does not bode well for the start of next year.
“Despite warning lights flashing in the industry, there are significantly more manufacturing companies looking ahead to the
coming year with confidence in December. The corresponding index has jumped upwards, possibly reflecting the fact that
the government has launched a number of transport projects, decided on reforms to reduce bureaucracy, and wants to
expand defence capabilities. Only if these measures result in an increase in incoming orders will the industry regain
momentum.
“The service sector is losing momentum for the second month in a row. However, business activity continues to grow visibly,
as evidenced by the stronger expansion of staff. New business has been increasing steadily for three months and overall,
the service sector is stabilizing the economy as a whole and is likely to contribute significantly to positive GDP growth in the
fourth quarter.
“While confidence in the manufacturing sector has increased visibly, the assessment of the next 12 months in the service
sector has weakened in December. It is possible that people believe that the economic stimulus package and higher
defence spending will primarily benefit construction companies, the mechanical engineering sector, and companies that
produce directly or as suppliers in the defence sector, while service providers tend to come away empty-handed.
“However,
this does not have to be the case, because industrial production usually also involves activities that are accompanied by
service providers such as consulting firms, auditors, and software developers. In addition, there are the so-called multiplier
effects, because employees of companies that receive additional (government) orders are more likely to treat themselves to
an extra visit to a restaurant or a concert that they would otherwise have foregone.”
This article was written by Giuseppe Dellamotta at investinglive.com.
France December flash services PMI 50.2 vs 51.1 expected
December 16, 2025 15:30 Forexlive Latest News Market News
- Prior 51.4
- Manufacturing PMI 50.6 vs 48.1 expected
- Prior 47.8
- Composite PMI 50.1 vs 50.3 expected
- Prior 50.4
It’s a polarising release with the French services sector slumping in December while the manufacturing sector posts a beat on activity. At the balance though, it still leads to a bit of a drag to the French economy with overall activity basically stagnating in the final month of the year. Looking at the details, employment conditions held up while price developments were little changed compared to November. HCOB notes that:
“French private sector business conditions appear largely static in December. The HCOB flash PMI remains marginally in
growth territory, yet it signals a softer expansion compared to the prior month, reflecting an economy still weighed down by
uncertainty among households and firms. Beneath the surface, however, sectoral adjustments have occurred: manufacturing
stabilised, whereas services lost momentum, leaving the aggregate picture flat and the overall French economy sluggish.
“The flash Manufacturing PMI managed a modest climb past the 50.0-point mark as the year drew to a close. December
brought encouraging signs in indices for both output and order books, with foreign demand providing a notable lift. Another
optimistic reading of the Future Output Index and a renewed willingness among firms to expand their workforces provides a
positive signal for the outlook.
“However, so long as no budget is passed by the government, political uncertainty will remain a noticeable headwind for
France’s economy. The passage of the social security budget is at least a small victory for Prime Minister Lecornu. However,
subdued consumer sentiment and intense international competitive pressures from the likes of the US and China diminish
growth prospects. The recently robust aviation industry could offer a glimmer of hope for the future by providing additional
impetus to the manufacturing sector more broadly.”
This article was written by Justin Low at investinglive.com.
Tuesday 16th December 2025: Technical Outlook and Review
December 16, 2025 15:14 ICMarkets Market News
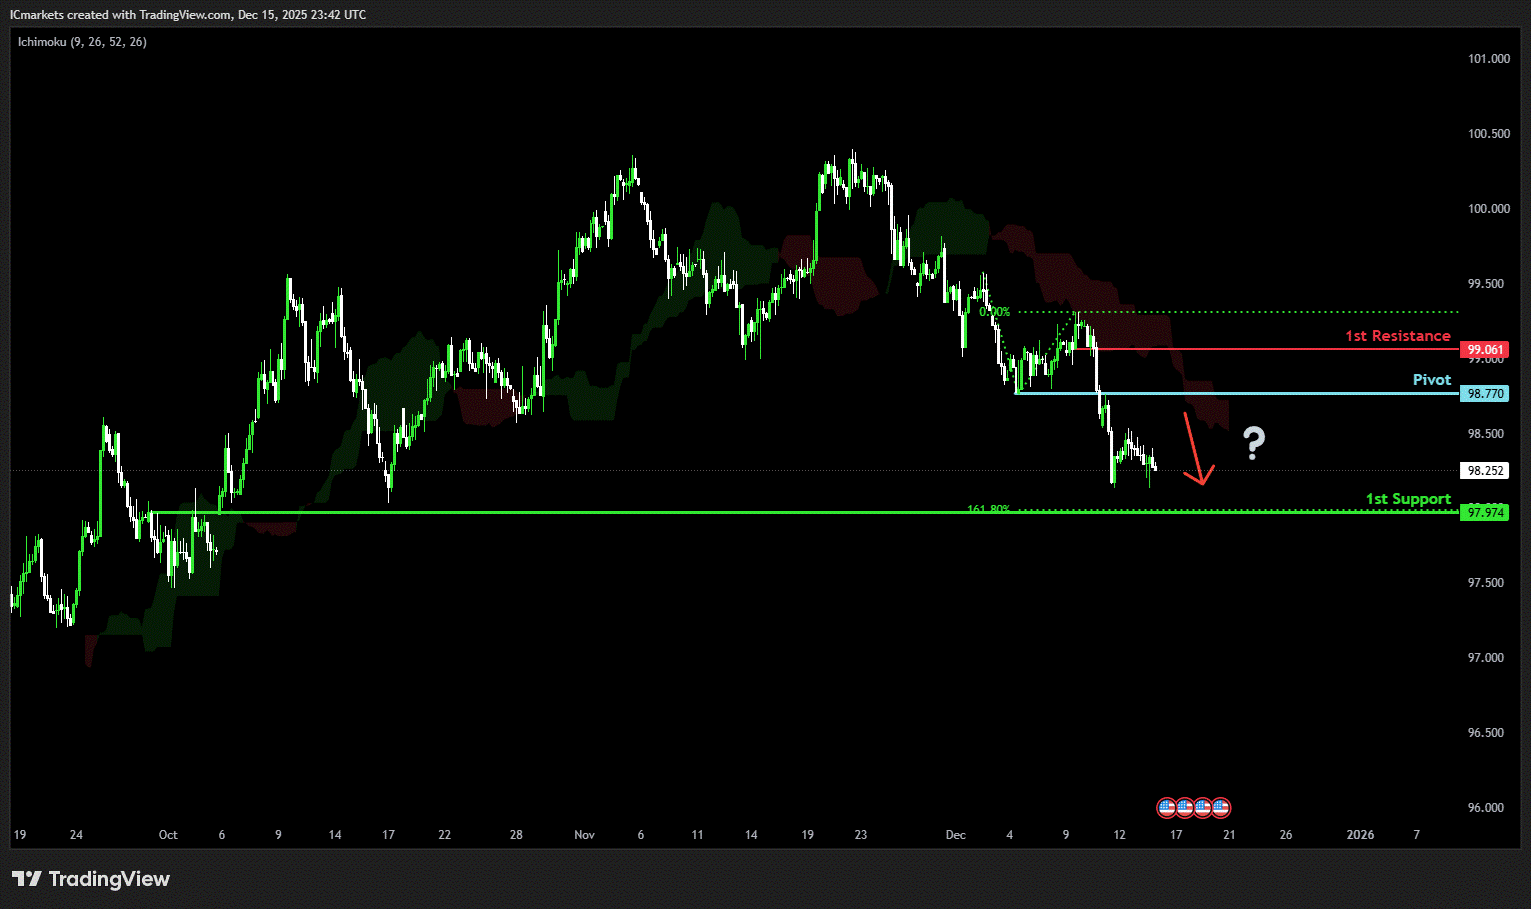
DXY (U.S. Dollar Index):
Potential Direction: Bearish
Overall momentum of the chart: Bearish
The price could see a short-term pullback toward the pivot before continuing its bearish move down toward the 1st support.
Pivot: 98.77
Supporting reasons: Identified as a pullback resistance, where selling pressures could intensify and potentially cap any upward retracement.
1st support: 97.97
Supporting reasons: Identified as an overlap support that aligns with the 161.8% Fibonacci extension, indicating a potential area where the price could again stabilize.
1st resistance: 99.06
Supporting reasons: Identified as a pullback resistance, indicating a potential area that could halt any further upward movement
EUR/USD:
Potential Direction: Bullish
Overall momentum of the chart: Bearish
The price could see a short-term pullback toward the pivot before rising again toward the 1st resistance.
Pivot: 1.1710
Supporting reasons: Identified as a pullback support, where renewed buying pressure could emerge to push the price higher.
1st support: 1.1644
Supporting reasons: Identified as a pullback support, indicating a potential level where the price could stabilize once again.
1st resistance: 1.1810
Supporting reasons: Identified as a swing high resistance that aligns closely with the 100% Fibonacci projection, indicating a potential level that could cap further upward movement.

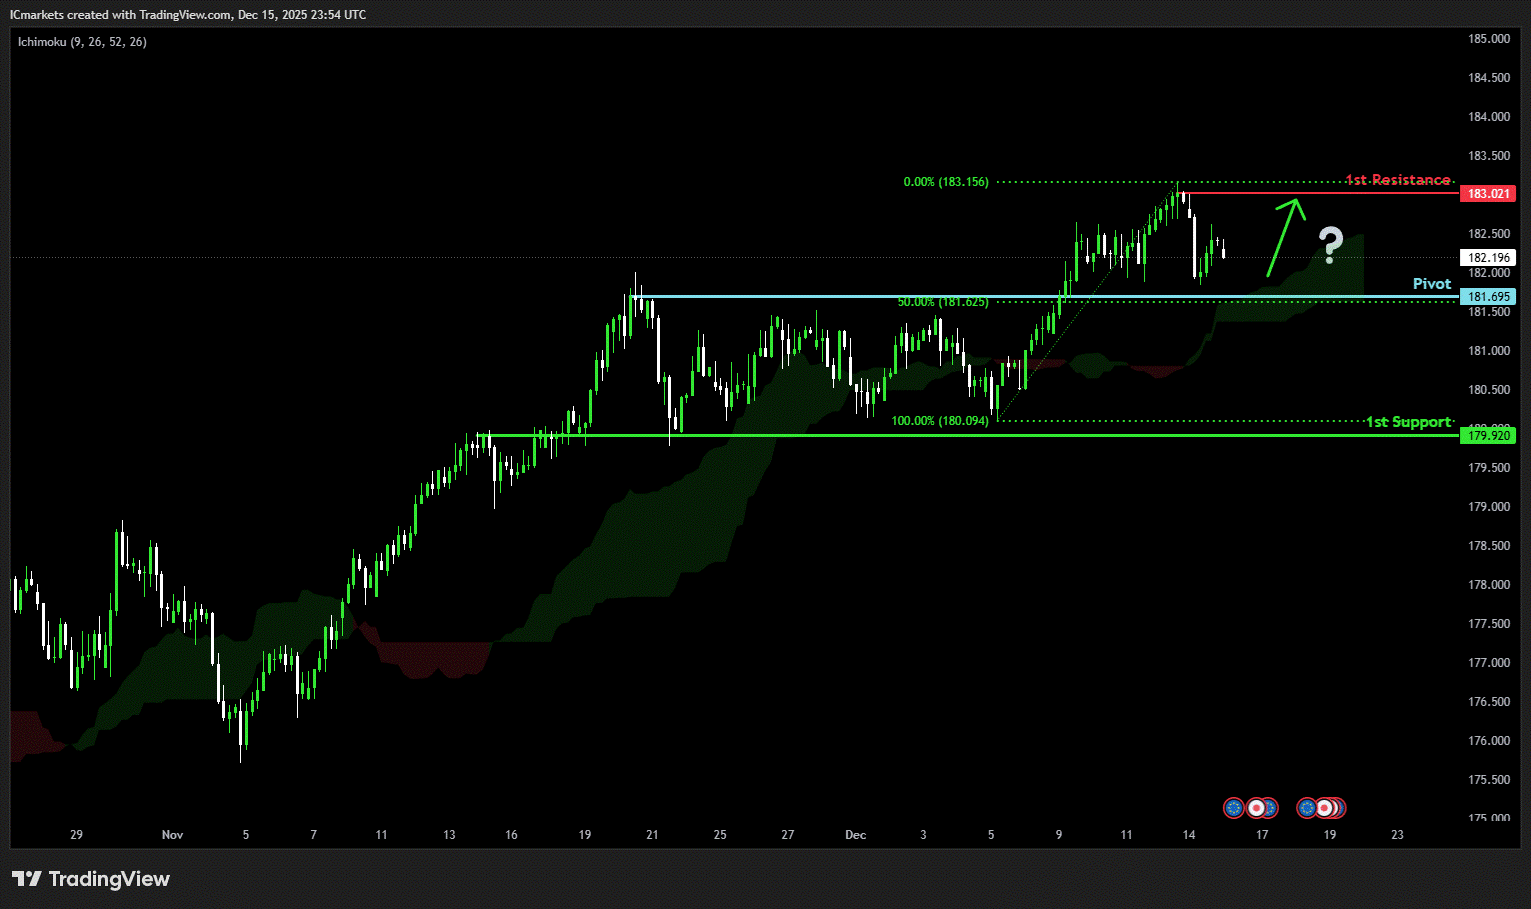
EUR/JPY:
Potential Direction: Bullish
Overall momentum of the chart: Bullish
The price could see a short-term pullback toward the pivot before rising again toward the 1st resistance.
Pivot: 181.69
Supporting reasons: Identified as a pullback support that aligns with the 50% Fibonacci retracement, where renewed buying pressure could emerge to push the price higher.
1st support: 179.92
Supporting reasons: Identified as a pullback support, indicating a potential area where the price could again stabilize.
1st resistance: 183.02
Supporting reasons: Identified as a swing high resistance, indicating a potential level that could cap further upward movement.
EUR/GBP:
Potential Direction: Bullish
Overall momentum of the chart: Bullish
The price could see a short-term pullback toward the pivot before rising again toward the 1st resistance.
Pivot: 0.8749
Supporting reasons: Identified as a pullback support, where renewed buying pressure could emerge to push the price higher.
1st support: 0.8722
Supporting reasons: Identified as a multi-swing low support, indicating a potential area where the price could stabilize once more.
1st resistance: 0.8799
Supporting reasons: Identified as an overlap resistance, indicating a potential level that could cap further upward movement.

GBP/USD:
Potential Direction: Bullish
Overall momentum of the chart: Bullish
The price could see a short-term pullback toward the pivot before rising again toward the 1st resistance.
Pivot: 1.3353
Supporting reasons: Identified as a pullback support, where renewed buying pressure could emerge to push the price higher.
1st support: 1.3287
Supporting reasons: Identified as an overlap support, indicating a potential area where the price could stabilize once more.
1st resistance: 1.3452
Supporting reasons: Identified as a swing high resistance, indicating a potential level that could halt further upward movement.
GBP/JPY:
Potential Direction: Bullish
Overall momentum of the chart: Bullish
The price could see a short-term pullback toward the pivot before rising again toward the 1st resistance.
Pivot: 207.17
Supporting reasons: Identified as an overlap resistance that aligns with the 50% Fibonacci retracement, where selling pressures could intensify and potentially cap any upward retracement
1st support: 205.32
Supporting reasons: Identified as an overlap support, indicating a potential level where the price could stabilize once more.
1st resistance: 208.94
Supporting reasons: Identified as a swing high resistance, indicating a potential level that could halt further upward movement.

USD/CHF:
Potential Direction: Bearish
Overall momentum of the chart: Bearish
The price could see a short-term pullback toward the pivot before continuing its bearish move down toward the 1st support.
Pivot: 0.7987
Supporting reasons: Identified as a pullback resistance, where selling pressures could intensify and potentially cap any upward retracement.
1st support: 0.7926
Supporting reasons: Identified as a pullback support that aligns with the 78.6% Fibonacci retracement, indicating a potential level where the price could stabilize once again.
1st resistance: 0.8028
Supporting reasons: Identified as a pullback resistance, indicating a potential level that could cap further upward movement.
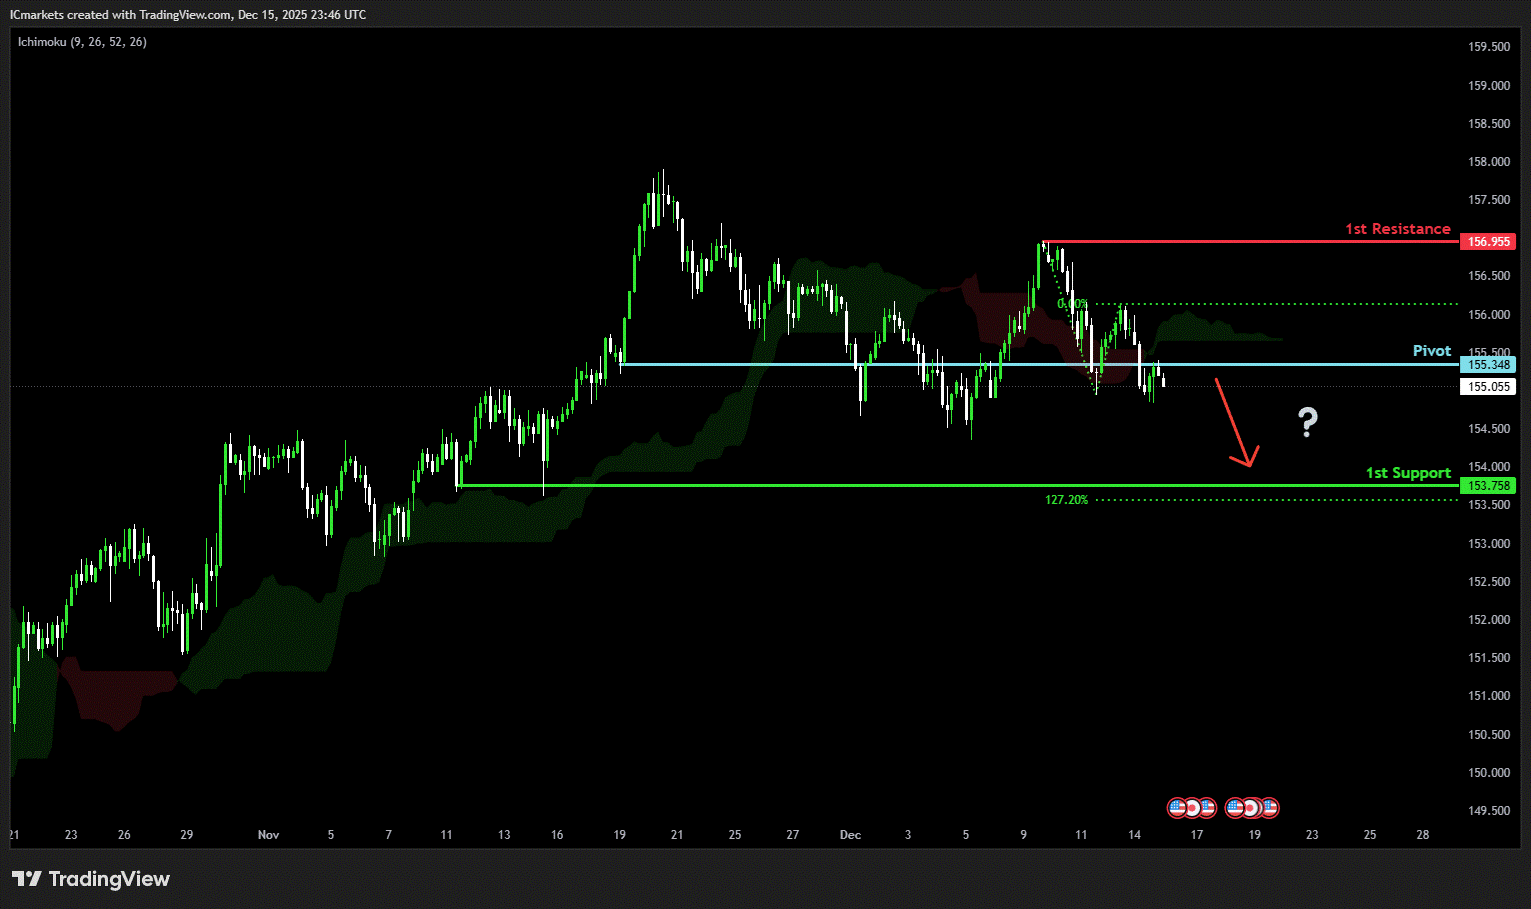
USD/JPY:
Potential Direction: Bearish
Overall momentum of the chart: Bullish
The price has already reacted off the pivot and may continue its bearish move toward the 1st support.
Pivot: 155.34
Supporting reasons: Identified as an overlap resistance, where selling pressures could intensify and potentially cap any upward retracement
1st support: 153.26
Supporting reasons: Identified as a swing low support that aligns closely with the 127.2% Fibonacci projection, indicating a strong area where buyers might return, and the price could stabilize once again.
1st resistance: 156.95
Supporting reasons: Identified as a swing high resistance. This level represents the next key area where upward movement could be capped amid increased selling pressure
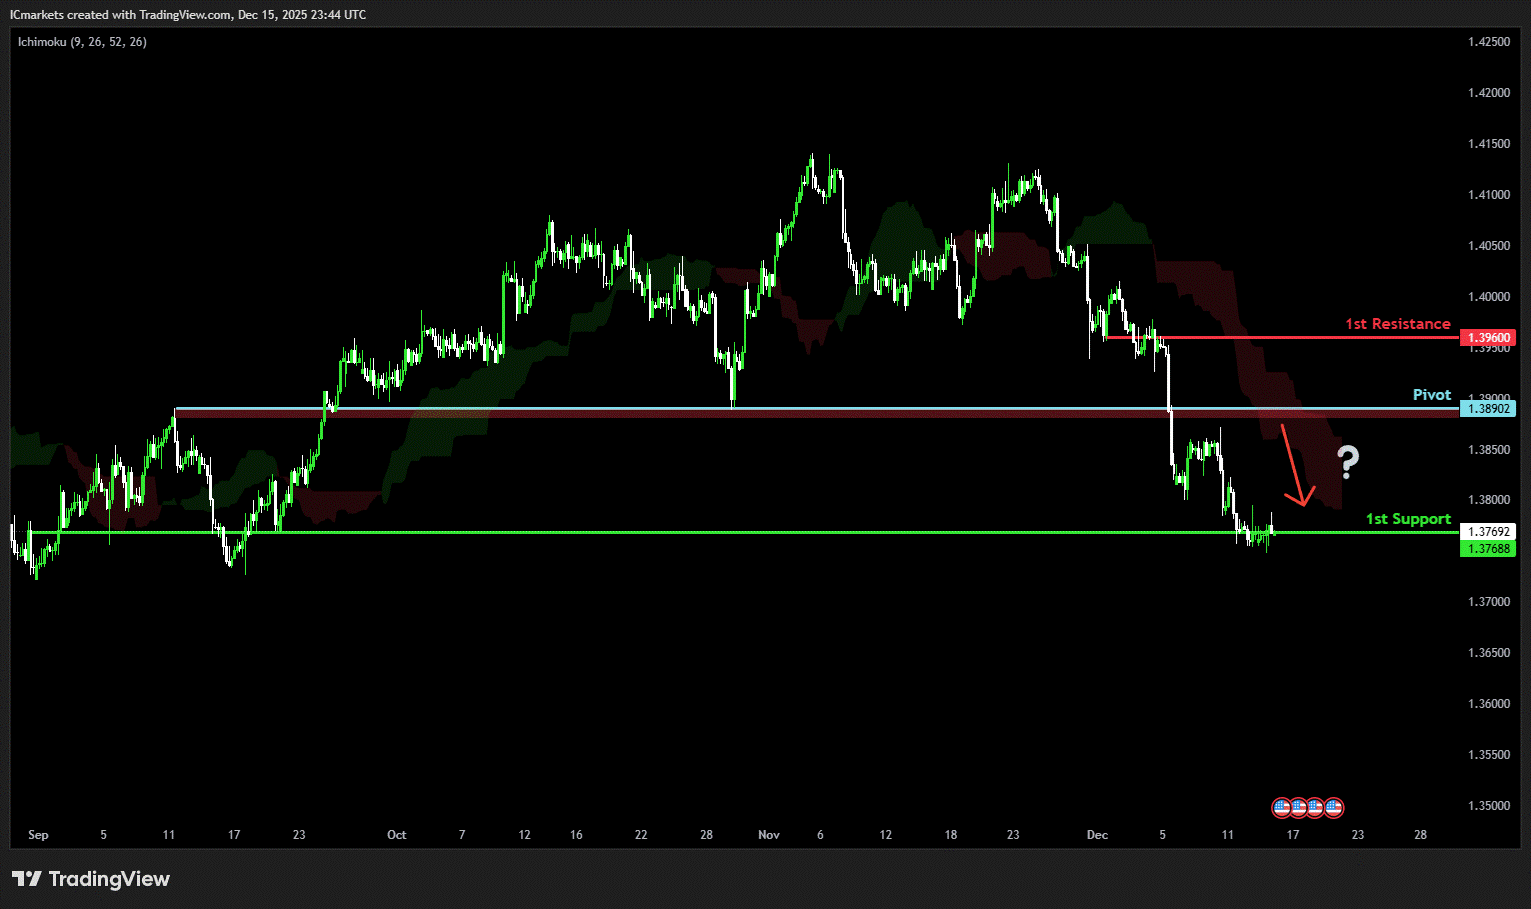
USD/CAD:
Potential Direction: Bearish
Overall momentum of the chart: Bearish
The price could see a short-term pullback toward the pivot before continuing its bearish move down toward the 1st support.
Pivot: 1.3890
Supporting reasons: Identified as a pullback resistance, where selling pressures could intensify and potentially cap any upward retracement.
1st support: 1.3768
Supporting reasons: Identified as a swing low support, indicating a key level where the price could stabilize once more.
1st resistance: 1.3960
Supporting reasons: Identified as an overlap resistance, making it a possible target for bullish advances and a level where some sellers could return to cap gains
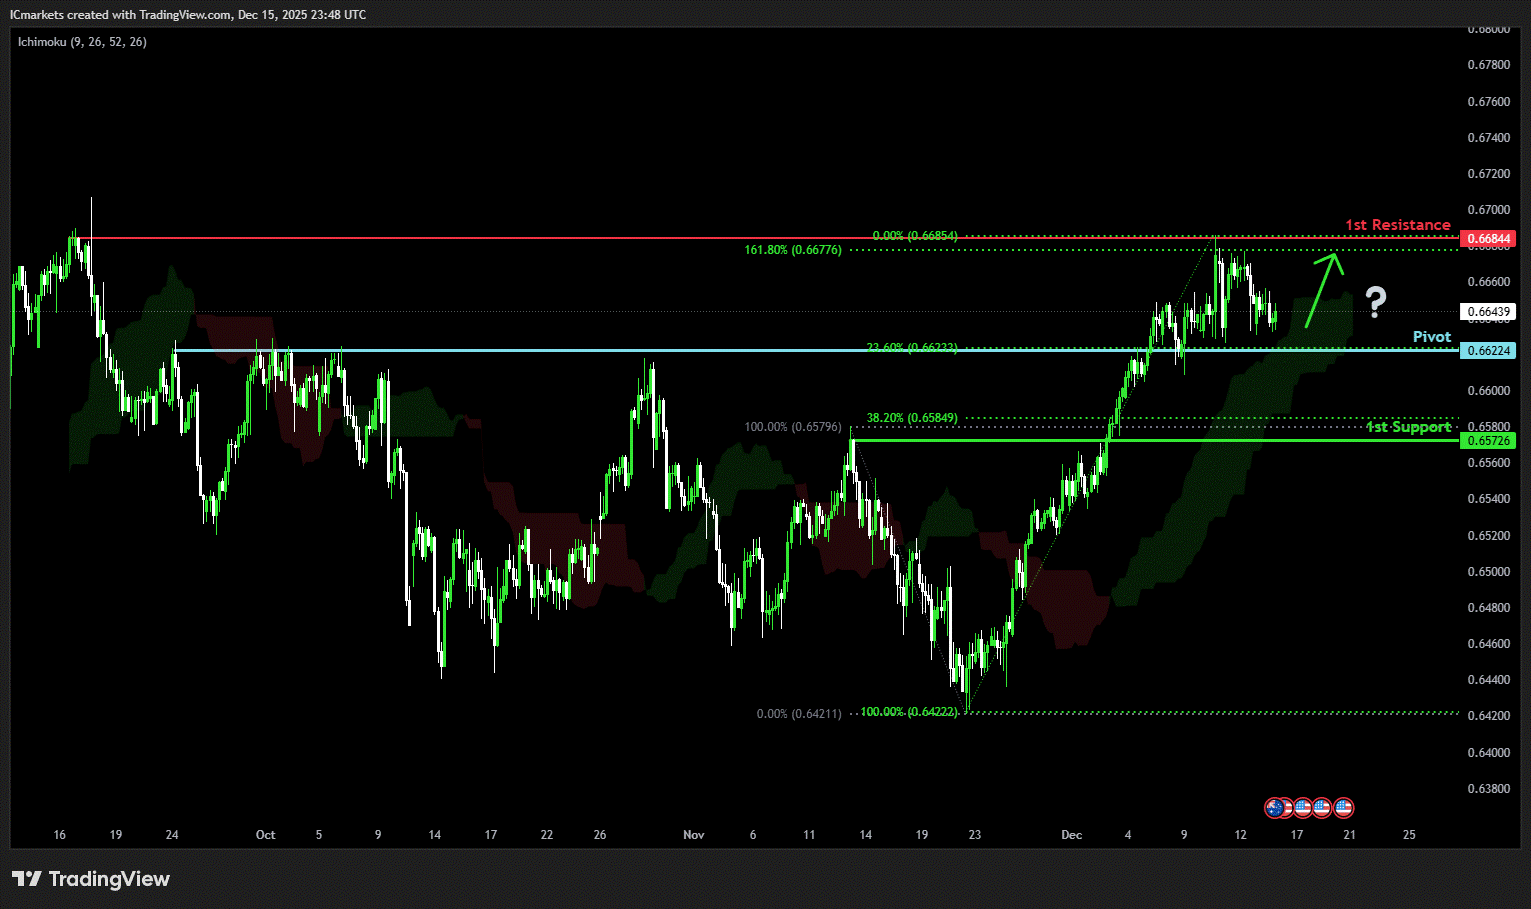
AUD/USD:
Potential Direction: Bullish
Overall momentum of the chart: Bullish
The price could see a short-term pullback toward the pivot before rising again toward the 1st resistance.
Pivot: 0.6622
Supporting reasons: Identified as an overlap support that aligns with the 23.6% Fibonacci retracement, where renewed buying pressure could emerge to push the price higher.
1st support: 0.6572
Supporting reasons: Identified as a pullback support that aligns with the 38.6% Fibonacci retracement, this area has provided strong support historically and may attract buying interest for a potential short-term bounce
1st resistance: 0.6684
Supporting reasons: Identified as an overlap resistance that aligns with the 161.8% Fibonacci extension, indicating a potential area that could halt any further upward movement.
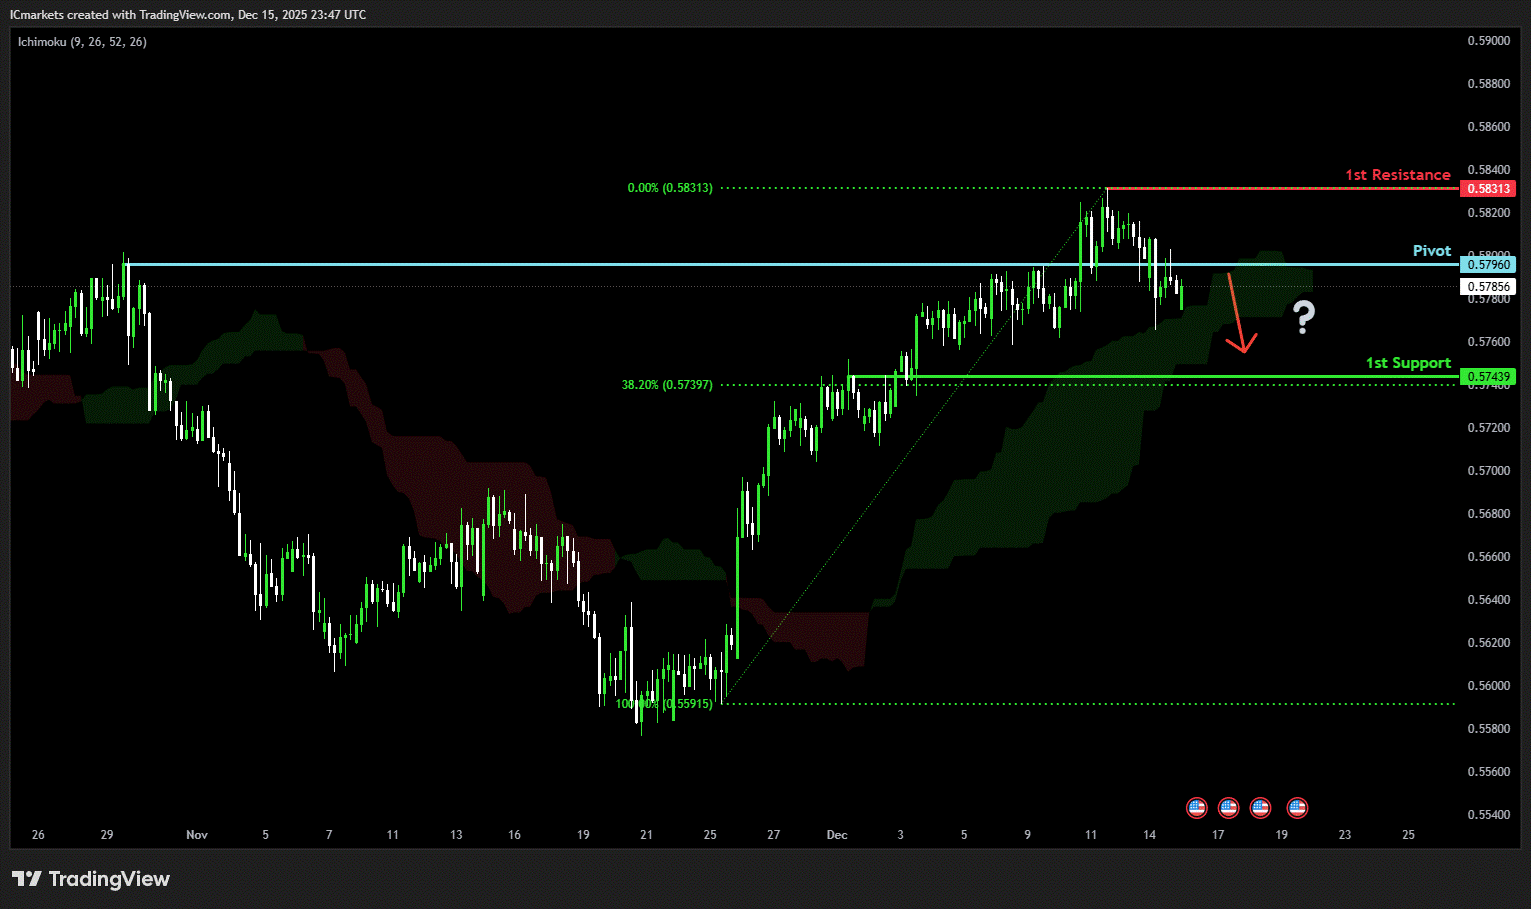
NZD/USD
Potential Direction: Bearish
Overall momentum of the chart: Bullish
The price could see a short-term pullback toward the pivot before continuing its bearish move down toward the 1st support.
Pivot: 0.5796
Supporting reasons: Identified as an overlap resistance, where selling pressures could intensify and potentially cap any upward retracement.
1st support: 0.5743
Supporting reasons: Identified as a pullback support that aligns with the 38.2% Fibonacci retracement, this area has provided strong support historically and may attract buying interest for a potential short-term bounce
1st resistance: 0.5831
Supporting reasons: Identified as a swing high resistance, indicating a potential area that could halt any further upward movement.
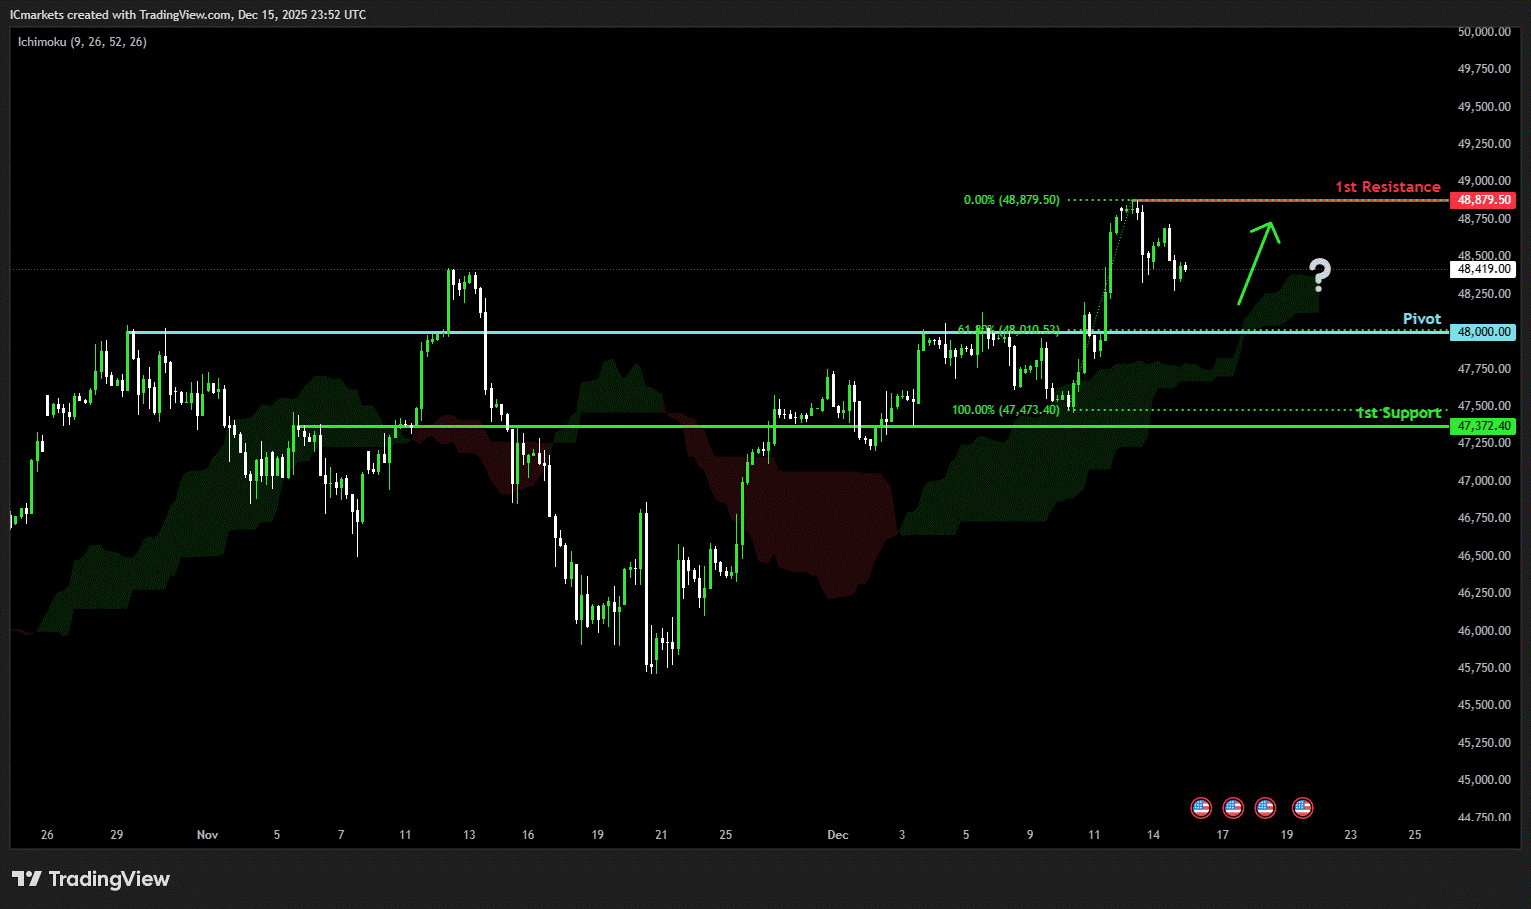
US30 (DJIA):
Potential Direction: Bullish
Overall momentum of the chart: Bullish
The price could see a short-term pullback toward the pivot before rising again toward the 1st resistance.
Pivot: 48,000
Supporting reasons: Identified as a pullback support that aligns with the 61.8% Fibonacci retracement, where renewed buying pressure could emerge to push the price higher.
1st support: 47,372.40
Supporting reasons: Identified as a pullback support, suggesting a potential area where the price could stabilize once again.
1st resistance: 48,879.50
Supporting reasons: Identified as a swing high resistance, indicating a potential area that could halt any further upward movement.
DE40 (DAX):
Potential Direction: Bullish
Overall momentum of the chart: Bullish
The price could see a short-term pullback toward the pivot before rising again toward the 1st resistance.
Pivot: 23,945.80
Supporting reasons: Identified as a pullback support, where renewed buying pressure could emerge to push the price higher.
1st support: 23,488.00
Supporting reasons: Identified as a pullback support, indicating a key level where the price could stabilize once more.
1st resistance: 24,444.50
Supporting reasons: Identified as a swing high resistance that aligns with the 100% Fibonacci projection, indicating a potential area that could halt any further upward movement.
US500 (S&P 500):
Potential Direction: Bullish
Overall momentum of the chart: Bullish
The price could see a short-term pullback toward the pivot before rising again toward the 1st resistance.
Pivot: 6,773.23
Supporting reasons: Identified as a pullback support that aligns with the 38.2% Fibonacci retracement, where renewed buying pressure could emerge to push the price higher.
1st support: 6,673.25
Supporting reasons: Identified as an overlap support that aligns with the 61.8% Fibonacci retracement, indicating a potential level where the price could stabilize once again.
1st resistance: 6,920.20
Supporting reasons: Identified as a swing high resistance, indicating a potential area that could halt any further upward movement.
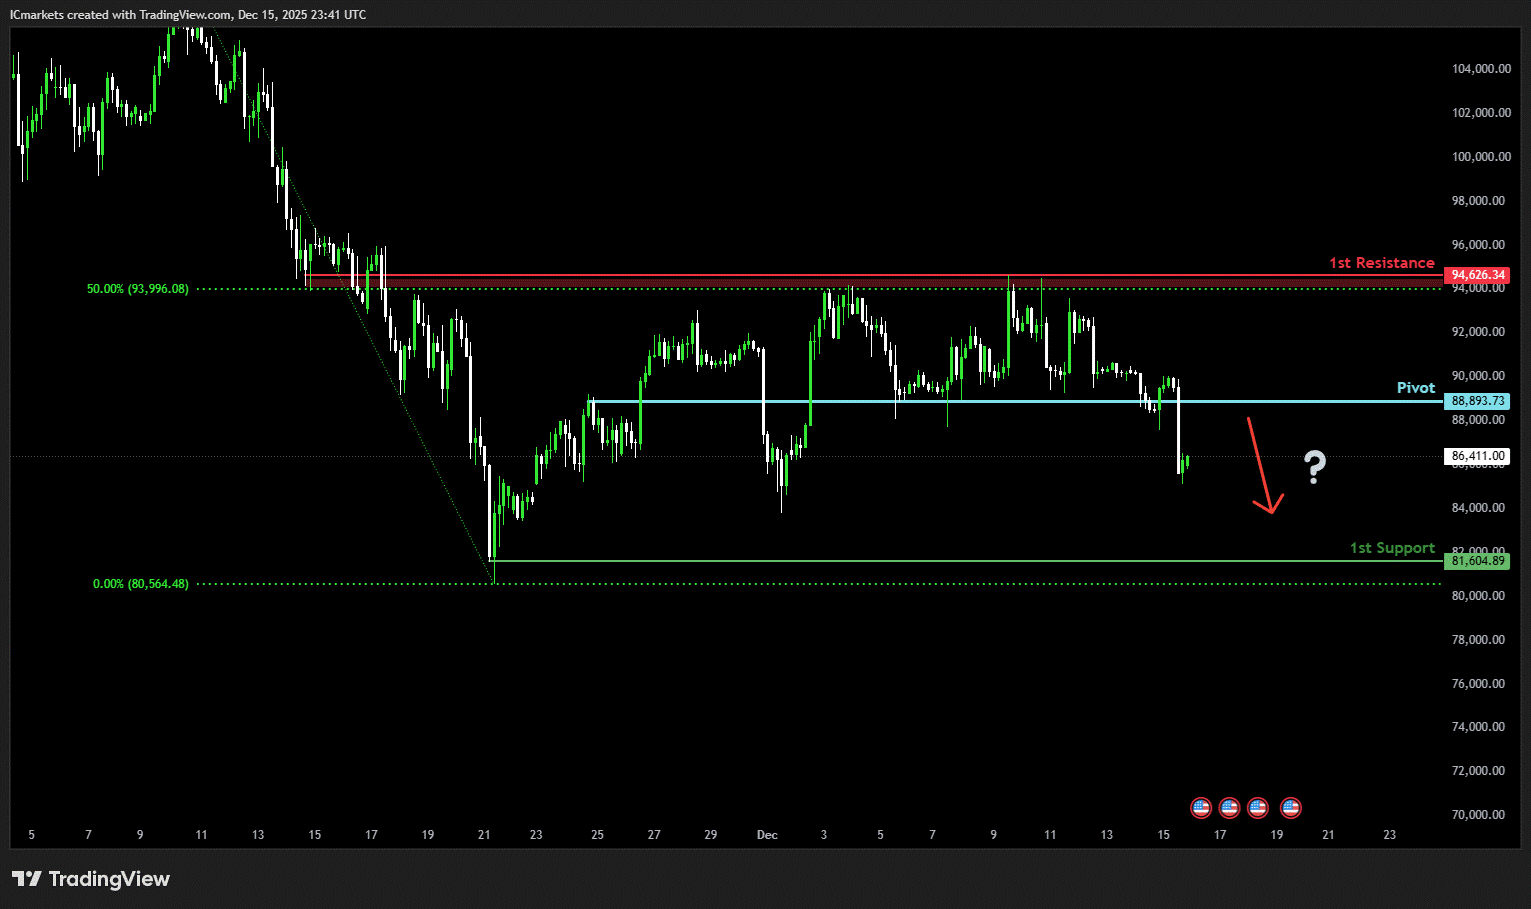
BTC/USD (Bitcoin):
Potential Direction: Bearish
Overall momentum of the chart: Bearish
The price could see a short-term pullback toward the pivot before continuing its bearish move down toward the 1st support.
Pivot: 88,893.73
Supporting reasons: Identified as a pullback resistance, where selling pressures could intensify and potentially cap any upward retracement.
1st support: 81604.89
Supporting reasons: Identified as a swing low support, indicating a potential level where the price could stabilize once more.
1st resistance: 94,626.23
Supporting reasons: Identified as an overlap resistance that aligns with the 50% Fibonacci retracement, indicating a potential area that could halt any further upward movement.
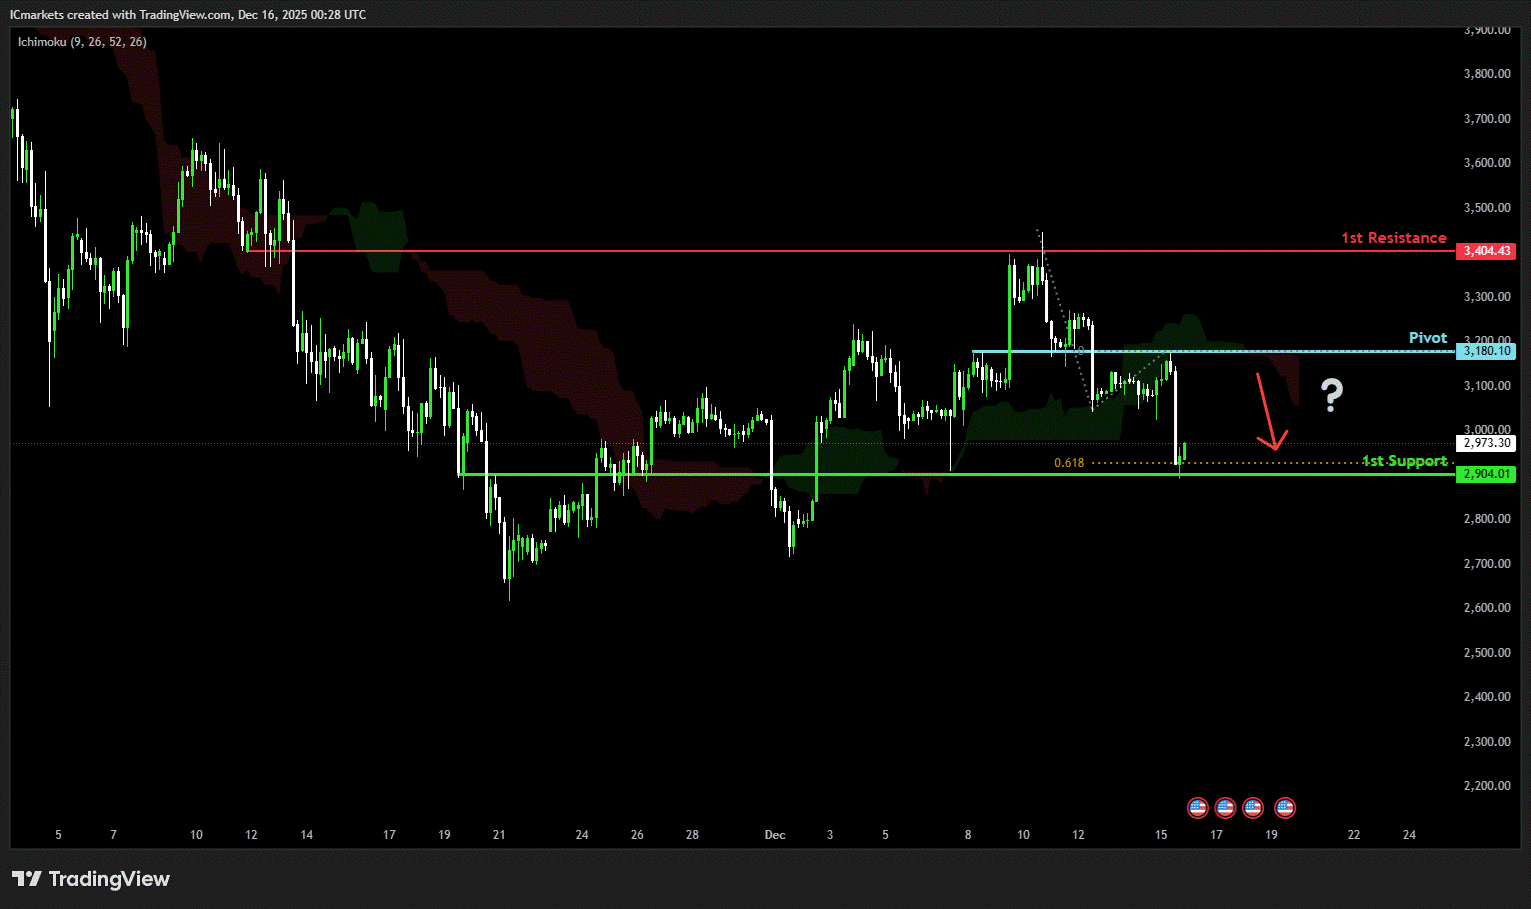
ETH/USD (Ethereum):
Potential Direction: Bearish
Overall momentum of the chart: Bullish
The price could see a short-term pullback toward the pivot before continuing its bearish move down toward the 1st support.
Pivot: 3,180.10
Supporting reasons: Identified as an overlap resistance, where selling pressures could intensify and potentially cap any upward retracement.
1st support: 2,904.01
Supporting reasons: Identified as an overlap support that aligns with the 61.8% Fibonacci projection, indicating a potential level where the price could stabilize once more.
1st resistance: 3,404.43
Supporting reasons: Identified as an overlap resistance, indicating a potential area that could halt any further upward movement.
WTI/USD (Oil):
Potential Direction: Bearish
Overall momentum of the chart: Bullish
The price could see a short-term pullback toward the pivot before continuing its bearish move down toward the 1st support.
Pivot: 57,52
Supporting reasons: Identified as a pullback resistance, where selling pressures could intensify and potentially cap any upward retracement.
1st support: 56.38
Supporting reasons: Identified as a swing low support that aligns with the 127.2% Fibonacci extension and the 100% Fibonacci projection, indicating a key level where the price could stabilize once more.
1st resistance: 58.35
Supporting reasons: Identified as a pullback resistance, indicating a potential area that could halt any further upward movement.
XAU/USD (GOLD):
Potential Direction: Bullish
Overall momentum of the chart: Bullish
The price could see a short-term pullback toward the pivot before rising again toward the 1st resistance.
Pivot: 4,255.04
Supporting reasons: Identified as a pullback support, where renewed buying pressure could emerge to push the price higher.
1st support: 4,145.75
Supporting reasons: Identified as a pullback support, indicating a key level where the price could stabilize once more.
1st resistance: 4,366.45
Supporting reasons: Identified as a swing high resistance that aligns with the 161.8% Fibonacci extension, indicating a potential area that could halt any further upward movement.

The accuracy, completeness and timeliness of the information contained on this site cannot be guaranteed. IC Markets Global does not warranty, guarantee or make any representations, or assume any liability regarding financial results based on the use of the information in the site.
News, views, opinions, recommendations and other information obtained from sources outside of www.icmarkets.com, used in this site are believed to be reliable, but we cannot guarantee their accuracy or completeness. All such information is subject to change at any time without notice. IC Markets Global assumes no responsibility for the content of any linked site.
The fact that such links may exist does not indicate approval or endorsement of any material contained on any linked site. IC Markets Global is not liable for any harm caused by the transmission, through accessing the services or information on this site, of a computer virus, or other computer code or programming device that might be used to access, delete, damage, disable, disrupt or otherwise impede in any manner, the operation of the site or of any user’s software, hardware, data or property.
The post Tuesday 16th December 2025: Technical Outlook and Review first appeared on IC Markets | Official Blog.
IC Markets Global – Asia Fundamental Forecast | 16 December 2025
December 16, 2025 15:14 ICMarkets Market News
IC Markets Global – Asia Fundamental Forecast | 16 December 2025
What happened in the U.S. session?
The U.S. session, markets traded in a consolidative, slightly risk‑on tone as investors positioned for a barrage of U.S. macro releases, including delayed jobs data, CPI, and retail sales that will refine expectations for the Fed’s 2026 easing path. U.S. indices saw mixed but generally stabilizing price action, with the S&P 500 and Dow attempting to recover from last week’s tech‑driven rout while the Nasdaq lagged on renewed concerns about AI‑related spending and profitability. U.S. Treasury yields nudged higher, and the curve steepened, supporting a marginally firmer dollar index, even as markets continued to embed additional cuts over the next year.
What does it mean for the Asia Session?
For Asian desks, the focus is on a synchronized run of PMIs from Japan and the eurozone, UK labour statistics, and a delayed US Employment Situation report paired with retail sales that together could reset expectations for global growth and major central‑bank paths. A softer‑than‑expected US jobs print or weak retail numbers would likely reinforce the medium‑term bearish tone in the dollar and favour EUR, GBP, AUD, and gold, while also pressuring risk assets on growth worries, whereas resilient employment and spending could revive USD strength and support equities and oil.
The Dollar Index (DXY)
Key news events today
ADP Weekly Employment Change (Tentative)
Average Hourly Earnings m/m (1:30 pm GMT)
Core Retail Sales m/m (1:30 pm GMT)
Non-Farm Employment Change (1:30 pm GMT)
Retail Sales m/m (1:30 pm GMT)
Unemployment Rate (1:30 pm GMT)
Flash Manufacturing PMI (2:45 pm GMT)
Flash Services PMI (2:45 pm GMT)
What can we expect from DXY today?
The U.S. dollar is trading with a soft, bearish tone today as markets continue to fade last week’s “hawkish” Fed cut and position ahead of a heavy data slate starting with the delayed jobs report on December 16. The Dollar Index has broken key support and remains in a pattern of lower highs and lower lows, reinforcing a medium‑bearish technical backdrop even as it holds slightly above levels seen a few months ago.
Central Bank Notes:
- The Federal Open Market Committee (FOMC) is widely expected to lower the federal funds rate target range by 25 basis points to 3.50%–3.75% at its December 9–10, 2025, meeting, marking the third consecutive cut after the October reduction to 3.75%–4.00%
- The Committee continues to pursue maximum employment and 2% inflation goals, with the labor market showing further softening as the unemployment rate rose to 4.4% in September 2025 amid modest job gains.
- Officials note persistent downside risks to growth alongside resilient activity, with inflation easing to 3.0% year-over-year CPI in September but remaining elevated due to tariff effects; core PCE stands at around 2.8% as of October.
- Economic activity grew at a 3.8% annualized pace in Q2 2025 per revised estimates, though Q3 and Q4 face headwinds from trade tensions, fiscal restraint, and data disruptions like the government shutdown.
- September’s Summary of Economic Projections forecasts 2025 unemployment at a median 4.5%, with PCE inflation near 3.0% and core PCE at 3.1%, signaling a gradual disinflation path; updates expected on December 10 may adjust for higher unemployment and lower growth.
- The Committee maintained its data-dependent approach, noting a softening labor market and inflation above the 2% target, while deciding to lower the federal funds rate target range by 25 basis points to 3.50%-3.75%. Dissent persisted, with multiple members opposing the cut or advocating for a hold, reflecting divisions similar to recent meetings.
- The FOMC confirmed the conclusion of its quantitative tightening program effective December 1, 2025, with Treasury rolloff caps at $5 billion per month and agency MBS caps at $35 billion per month to ensure ample reserves and market stability.
- The next meeting is scheduled for 27 to 28 January 2026.
Next 24 Hours Bias
Medium Bearish
Gold (XAU)
Key news events today
ADP Weekly Employment Change (Tentative)
Average Hourly Earnings m/m (1:30 pm GMT)
Core Retail Sales m/m (1:30 pm GMT)
Non-Farm Employment Change (1:30 pm GMT)
Retail Sales m/m (1:30 pm GMT)
Unemployment Rate (1:30 pm GMT)
Flash Manufacturing PMI (2:45 pm GMT)
Flash Services PMI (2:45 pm GMT)
What can we expect from Gold today?
Gold is trading near record territory on Tuesday, hovering around the 4,330–4,350 USD/oz area after a powerful multi‑week rally fuelled by Federal Reserve rate cuts, softer real yields, and strong safe‑haven demand. The short‑term tone is still bullish, but momentum is moderating, with intraday focus on whether upcoming U.S. labour data later today will push prices to retest October’s all‑time highs around 4,380–4,400 USD/oz or trigger a consolidation from elevated levels.
Next 24 Hours Bias
Strong Bullish
The Australian Dollar (AUD)
Key news events today
No major news event
What can we expect from AUD today?
The Australian Dollar enters Tuesday on a firm footing, trading just below recent highs as markets digest a steady but hawkish RBA, softer but still resilient domestic data, and a comparatively more dovish Federal Reserve backdrop. While lingering concerns about China’s growth and patchy labour figures could cap further near‑term gains, the combination of supportive yield differentials and expectations for stable to slightly higher Australian rates keeps sentiment toward the AUD constructive in the short to medium term.
Central Bank Notes:
- The Reserve Bank of Australia held its cash rate steady at 3.60% at the November 2025 policy meeting, adopting a cautious tone amid a surprise uptick in inflation data for the September quarter. This marks the fourth consecutive pause since the 25 basis point cut in August. The Board attributed some of the inflation rise to temporary factors like higher petrol prices and council rates, but noted signs of more persistent pressures from consumer demand.
- Policymakers emphasized vigilance on inflation, with trimmed mean inflation expected to remain elevated in the near term before nearing the 2–3% target midpoint by mid-2027. Recent data showed underlying inflation staying above target until at least the second half of 2026, prompting upward revisions to forecasts. Capacity pressures are seen as slightly more pronounced than previously assessed, delaying any easing.
- Headline CPI for the September quarter exceeded expectations, driven partly by temporary items, while underlying measures signal ongoing stickiness. The shift to monthly CPI reporting, with the first full edition in November 2025, will enhance real-time inflation monitoring. Housing and services remain resilient contributors to price pressures.
- Domestic demand shows firmness in services alongside below-trend growth elsewhere, with capacity pressures not expected to ease significantly. The labor market is gradually softening, with unemployment projected to stabilize around 4.4%, though wage growth and productivity dynamics keep unit labor costs a concern. Household spending faces headwinds from high borrowing costs.
- Global risks include geopolitical tensions and commodity volatility, set against modestly revised-up world growth outlooks. The Board describes its policy as mildly restrictive and data-dependent, balancing inflation control with employment goals. No rate hike was considered despite the inflation surprise.
- Monetary policy remains mildly restrictive to address lingering price stability risks amid household and global vulnerabilities. Communications reaffirm the dual mandate of 2–3% inflation and full employment, with readiness to adjust based on incoming data.
- Market expectations point to the cash rate holding through early 2026, with a possible modest cut to 3.3% mid-year if inflation eases as forecast. The new monthly CPI data will be key for timely insights.
- Monetary policy remains mildly restrictive, balancing progress on price stability against vulnerabilities in household demand and global outlook. Board communications reaffirm a dual mandate: price stability and full employment, while underscoring readiness to respond should risks materialize sharply.
- Analysts generally expect the cash rate to remain at current levels through early 2026, with only modest cuts possible later in the year if inflation moderates. The new monthly CPI release (first full edition Nov 2025) will be watched closely for timely signals on price trends.
- The next meeting is on 2 to 3 February 2026.
Next 24 Hours Bias
Medium Bullish
The Kiwi Dollar (NZD)
Key news events today
No major news event
What can we expect from NZD today?
The New Zealand Dollar is holding firm near the 0.58 level against the US Dollar after a recent climb to multi‑week highs, underpinned by expectations that the Reserve Bank of New Zealand is nearing the end of its rate‑cut cycle and by a softer US Dollar. However, lingering concerns about the strength of China’s recovery and the global growth outlook are tempering bullish momentum, leaving the NZD in a consolidative range as traders await the next round of key data and central‑bank signals.
Central Bank Notes:
- The Monetary Policy Committee (MPC) left the Official Cash Rate (OCR) unchanged at 2.25% at its 26 November 2025 meeting, following the widely anticipated 25-basis-point reduction from 2.50%, and signaled that policy is now firmly in stimulatory territory while keeping the option of further easing on the table if needed.
- The decision was again reached by consensus, with members judging that the cumulative 325 basis points of easing over the past year warranted a period of assessment, even as several emphasized a willingness to cut further should incoming data point to a more protracted downturn or renewed disinflationary pressures.
- Headline consumer price inflation is projected to hover near 3% in late 2025 before gradually easing toward the 2% midpoint of the 1–3% target band through 2026, supported by contained inflation expectations around 2.3% over the two-year horizon and an expected pickup in spare capacity.
- The MPC noted that domestic demand remains subdued but shows tentative signs of stabilisation, with softer household spending and construction only partially offset by improving services activity; nevertheless, policymakers still expect services inflation to ease as wage growth moderates and the labour market loosens further over the coming year.
- Financial conditions continue to ease as wholesale and retail borrowing rates reprice to the lower OCR, contributing to gradually rising mortgage approvals and improving housing-related sentiment, although broader business credit growth remains patchy and sensitive to uncertainty about the durability of the recovery.
- Recent data confirm that GDP momentum is weak but not deteriorating as sharply as earlier in 2025, with high-frequency indicators pointing to a shallow recovery from a low base and ongoing headwinds from elevated living costs and fragile confidence weighing on discretionary consumption and investment.
- The MPC reiterated that external risks remain skewed to the downside, particularly from softer Chinese demand and uncertainty around United States trade policy, but noted that a lower New Zealand dollar continues to provide some offset via improved export competitiveness and support for tradables inflation.
- Looking ahead to early 2026, the Committee maintained a mild easing bias, indicating that a further cut toward 2.00–2.10% cannot be ruled out if activity fails to gain traction or if inflation undershoots projections, but current forecasts envisage the OCR remaining near 2.25% for an extended period provided inflation converges toward target and the recovery proceeds broadly as expected.
- The next meeting is on 18 February 2026.
Next 24 Hours Bias
Medium Bullish
The Japanese Yen (JPY)
Key news events today
No major news event
What can we expect from JPY today?
Today, the Japanese yen is trading slightly firmer around the mid‑155 per dollar area, benefitting from safe‑haven demand and rising expectations that the Bank of Japan will hike rates from 0.5% to 0.75% at this week’s policy meeting, even as it remains weak by historical standards. Improved business confidence readings and persistent concern over past yen weakness have encouraged markets to price in a more hawkish BoJ path, while simultaneous bets on further Federal Reserve rate cuts have narrowed US‑Japan yield differentials and pressured USD/JPY off its recent highs near 157–158.
Central Bank Notes:
- The Policy Board of the Bank of Japan met on 30–31 October and, by a clear majority vote, decided to maintain its key monetary policy approach for the upcoming period.
- The BOJ will continue to encourage the uncollateralized overnight call rate to remain at around 0.5%, in line with the prior stance.
- The gradual quarterly reduction in monthly outright purchases of Japanese Government Bonds (JGBs) remains intact, with amounts unchanged from the previous schedule. Purchases are set to decrease by about ¥400 billion per quarter through March 2026, shifting to about ¥200 billion per quarter from April to June 2026, and targeting a ¥2 trillion purchase level for Q1 2027. The bank reaffirmed its intention to maintain flexibility, with readiness to respond if market conditions warrant an adjustment.
- Japan’s economy continues to show moderate recovery, primarily led by solid capital expenditures, although export growth and corporate activity remain restrained by external demand uncertainty and the ongoing effects of U.S. trade policies.
- Annual headline inflation (excluding fresh food) accelerated to 2.9% year-on-year in September, marking the first uptick in four months and staying above the BOJ’s 2% target. Broad-based inflation persists, with food and energy cost pressures, but wage growth continues to support household consumption. Input cost pressures from the earlier surge in imports eased slightly.
- Short-term inflation momentum could moderate as food-price hikes ease, though rent, healthcare, and service-sector price increases tied to labor shortages provide support. Firms and households maintain a gradual upward drift in inflation expectations.
- For the near term, BOJ projects growth below trend as external demand stays subdued and corporate investment plans remain cautious. Still, accommodative financial conditions and steady gains in real labor income will underpin domestic consumption.
- Over the medium term, as overseas economies recover and trade conditions normalize, Japan’s growth potential should improve. Persistent labor market tightness, higher wage settlements, and rising medium- to long-term inflation expectations are expected to keep core inflation on a gradual upward trajectory, converging toward the 2% price stability target later in the forecast horizon.
- The next meeting is scheduled for 18 to 19 December 2025.
Next 24 Hours Bias
Medium Bearish
Oil
Key news events today
API Crude Oil Stock (8:30 pm GMT)
What can we expect from Oil today?
Today’s oil market tone is cautiously weak‑to‑neutral: prices are stabilising just above recent lows, but sentiment remains weighed down by expectations of ample supply and rising inventories, with rallies seen as vulnerable unless there is a clear bullish surprise on demand or a fresh supply disruption.
Next 24 Hours Bias
Medium Bearish
The post IC Markets Global – Asia Fundamental Forecast | 16 December 2025 first appeared on IC Markets | Official Blog.
IC Markets Global – Europe Fundamental Forecast | 16 December 2025
December 16, 2025 15:00 ICMarkets Market News
IC Markets Global – Europe Fundamental Forecast | 16 December 2025
What happened in the Asia session?
Asian markets traded defensively on December 16, 2025, with equities like Nikkei and Kospi leading losses (down ~1%) due to Wall Street rotation and pending US data, alongside softer NZ spending and awaited India PMIs; yen and gold gained while AUDUSD weakened. The Nikkei 225 dropped 1.27% (basic materials and real estate sectors were hit hardest), while the Kospi fell 0.75-1.13%. Additionally, GIFT Nifty futures declined 0.10%. Yen strengthened notably ahead of BOJ, AUDUSD slipped 0.2% to 0.6639 post-Australia’s softer PMI, while gold steadied as a haven.
What does it mean for the Europe & US sessions?
As European and U.S. sessions open, trading remains cautious with sparse data focusing on ECB updates and minor U.S. inventories, while eyes fix on Tuesday’s delayed U.S. retail sales and jobs report, plus Thursday’s ECB meeting expected to hold rates at 2%. Positive European equity momentum persists amid bank strength and global policy hopes, but dollar volatility looms from U.S. figures.
The Dollar Index (DXY)
Key news events today
ADP Weekly Employment Change (Tentative)
Average Hourly Earnings m/m (1:30 pm GMT)
Core Retail Sales m/m (1:30 pm GMT)
Non-Farm Employment Change (1:30 pm GMT)
Retail Sales m/m (1:30 pm GMT)
Unemployment Rate (1:30 pm GMT)
Flash Manufacturing PMI (2:45 pm GMT)
Flash Services PMI (2:45 pm GMT)
What can we expect from DXY today?
On Tuesday, the US dollar remained defensive near multi-month lows, with the DXY index dipping to 98.26 as markets braced for long-delayed October-November jobs data at 8:30 a.m. ET, delayed by the longest US government shutdown on record; this follows a recent Fed rate cut to 3.50-3.75% and signals of more easing, amplifying year-to-date losses exceeding 9% amid cooling labor indicators and falling Treasury yields.
Central Bank Notes:
- The Federal Open Market Committee (FOMC) is widely expected to lower the federal funds rate target range by 25 basis points to 3.50%–3.75% at its December 9–10, 2025, meeting, marking the third consecutive cut after the October reduction to 3.75%–4.00%
- The Committee continues to pursue maximum employment and 2% inflation goals, with the labor market showing further softening as the unemployment rate rose to 4.4% in September 2025 amid modest job gains.
- Officials note persistent downside risks to growth alongside resilient activity, with inflation easing to 3.0% year-over-year CPI in September but remaining elevated due to tariff effects; core PCE stands at around 2.8% as of October.
- Economic activity grew at a 3.8% annualized pace in Q2 2025 per revised estimates, though Q3 and Q4 face headwinds from trade tensions, fiscal restraint, and data disruptions like the government shutdown.
- September’s Summary of Economic Projections forecasts 2025 unemployment at a median 4.5%, with PCE inflation near 3.0% and core PCE at 3.1%, signaling a gradual disinflation path; updates expected on December 10 may adjust for higher unemployment and lower growth.
- The Committee maintained its data-dependent approach, noting a softening labor market and inflation above the 2% target, while deciding to lower the federal funds rate target range by 25 basis points to 3.50%-3.75%. Dissent persisted, with multiple members opposing the cut or advocating for a hold, reflecting divisions similar to recent meetings.
- The FOMC confirmed the conclusion of its quantitative tightening program effective December 1, 2025, with Treasury rolloff caps at $5 billion per month and agency MBS caps at $35 billion per month to ensure ample reserves and market stability.
- The next meeting is scheduled for 27 to 28 January 2026.
Next 24 Hours Bias
Medium Bearish
Gold (XAU)
Key news events today
ADP Weekly Employment Change (Tentative)
Average Hourly Earnings m/m (1:30 pm GMT)
Core Retail Sales m/m (1:30 pm GMT)
Non-Farm Employment Change (1:30 pm GMT)
Retail Sales m/m (1:30 pm GMT)
Unemployment Rate (1:30 pm GMT)
Flash Manufacturing PMI (2:45 pm GMT)
Flash Services PMI (2:45 pm GMT)
Empire State Manufacturing Index (1:30 pm GMT)
What can we expect from Gold today?
Gold is trading a little above 4,300 USD/oz today, Tuesday, hovering near record highs as investors continue to rotate toward safe‑haven assets and away from risk amid a softer dollar and lower real yields. The dominant narrative is that expectations for further US Federal Reserve rate cuts in 2026, combined with ongoing macro and geopolitical uncertainty, are underpinning strong bullion demand and encouraging buy‑on‑dip behavior from both traders and longer‑term allocators.
Next 24 Hours Bias
Medium Bullish
The Euro (EUR)
Key news events today
French Flash Manufacturing PMI (8:15 am GMT
French Flash Services PMI (8:15 am GMT)
German Flash Manufacturing PMI (8:30 am GMT)
German Flash Services PMI (8:30 am GMT)
What can we expect from EUR today?
On Tuesday, the euro is consolidating near recent highs against the U.S. dollar, with EUR/USD hovering in the mid‑1.17s after a strong 12‑month run, but short‑term trading is choppy as the pair stalls below key resistance around 1.18. A stable macro backdrop in the euro area with inflation slightly above 2% and modest but resilient growth supports expectations that the ECB will keep rates unchanged, while continuing balance‑sheet runoff.
Central Bank Notes:
- The Governing Council of the ECB kept the three key interest rates unchanged at its 30 October 2025 meeting. The main refinancing rate remains at 2.15%, the marginal lending facility at 2.40%, and the deposit facility at 2.00%. This decision reflects policymakers’ assessment that the current monetary stance remains consistent with medium-term price stability, while incoming data confirm a gradual return of inflation towards the target.
- Recent indicators point to stable price dynamics. Headline inflation remains near the 2% mark, with energy prices contained and food inflation easing slightly after earlier supply bottlenecks. Wage growth continues to moderate, contributing to the slowdown in domestic cost pressures. The ECB reiterated its commitment to a data-driven, meeting-by-meeting approach and emphasized flexibility amid uncertain global financial conditions.
- Eurosystem staff projections have not been materially altered since September. Headline inflation averages remain at 2.0% for 2025, 1.8% for 2026, and 2.0% for 2027. Recent softening in producer prices and subdued pipeline pressures suggest limited upside risks to inflation, though geopolitical tensions and potential commodity shocks continue to pose uncertainties to the outlook.
- Euro area GDP growth remains on track with earlier forecasts, projected at 1.1% for 2025, 1.1% for 2026, and 1.4% for 2027. Forward-looking indicators, including PMIs and industrial sentiment surveys, signal some stabilization in activity following weakness in the third quarter. Public investment and recovering export activity are expected to offset softer private sector demand in the near term.
- The labor market remains resilient, with unemployment rates at multi-decade lows and participation rates strong. Real income growth continues to support household spending, even as consumption growth normalizes from earlier highs. Financing conditions remain favorable, supported by stable banking-sector liquidity and improved credit demand among small and medium-sized firms.
- Business sentiment remains mixed, reflecting lingering uncertainty over global trade policy and the path of US tariffs. However, easing supply chain costs and improved export competitiveness due to softer exchange rates are providing some relief to manufacturing and external-oriented sectors.
- The Governing Council reaffirmed that future decisions will depend on an integrated assessment of incoming data—covering inflation trends, financial conditions, and the state of policy transmission. The Council emphasized that no pre-set path for rates exists; keeping all options open should the economic outlook shift markedly.
- Balance sheet reduction continues smoothly, with holdings under the APP and PEPP declining as reinvestments have ceased. The ECB confirmed that the pace of portfolio runoff remains in line with its previously communicated normalization plan, supporting a gradual withdrawal of monetary accommodation in a predictable manner.
- The next meeting is on 17 to 18 December 2025
Next 24 Hours Bias
Medium Bullish
The Swiss Franc (CHF)
Key news events today
No major news event
What can we expect from CHF today?
The Swiss franc remains one of the strongest major currencies going into Tuesday, 16 December 2025, with USD/CHF consolidating just under 0.80 and EUR/CHF near recent lows after the SNB kept its policy rate at 0% last week and slightly upgraded its growth outlook while signaling readiness to intervene in FX markets if needed. Persistently weak producer and import prices highlight ongoing deflationary pressure, but with inflation viewed as contained and the franc still in demand as a safe‑haven asset, markets expect the SNB to keep rates unchanged for an extended period and manage the currency mainly through interventions rather than renewed negative rates.
Central Bank Notes:
- At its 11 December 2025 monetary policy assessment, the Swiss National Bank (SNB) is widely expected to leave the policy rate unchanged at 0%, extending the pause that began in September as the Governing Board judges that current settings are sufficient to keep inflation near, but still below, its target while avoiding an unnecessary move into negative rates.
- Recent data show that the tentative rebound in Swiss inflation has stalled, with headline CPI easing from 0.1% year‑on‑year in October to 0.0% in November and core inflation slipping to about 0.4%, reinforcing the view that underlying price pressures remain very weak and that deflation risks, while contained, have not fully disappeared.
- The SNB’s conditional inflation forecast is likely to remain close to the September projections, with inflation still seen averaging roughly 0.2% in 2025, 0.5% in 2026, and 0.7% in 2027 under an unchanged policy rate path, though the latest CPI prints argue for a slightly lower near‑term profile and keep open the option of renewed easing if activity or prices weaken further.
- The global backdrop has deteriorated further, as continuing U.S. tariff actions and softer external demand weigh on world trade, while uncertainty in key European and U.S. markets for Swiss exports persists, leaving the SNB cautious about the growth outlook despite Switzerland’s relatively resilient domestic demand.
- Business and labor‑market sentiment in export‑oriented manufacturing remains subdued, with firms reporting pressure on margins from the still‑strong franc and softer foreign orders, although the broader economy is still expected to grow at around 1–1.5% in 2025 and unemployment only drifting up gradually from low levels.
- The SNB continues to stress its willingness to act if deflation risks re‑emerge, reiterating that it can ease policy through renewed rate cuts or targeted foreign‑exchange intervention if necessary, while also highlighting its commitment to transparent communication, including the publication of detailed minutes from recent assessments and ongoing dialogue with international partners on FX policy
The next meeting is on 19 March 2026.
Next 24 Hours Bias
Medium Bullish
The Pound (GBP)
Key news events today
Claimant Count Change (7:00 am GMT)
Average Earnings Index 3m/y (7:00 am GMT)
Flash Manufacturing PMI (9:30 am GMT)
Flash Services PMI (9:30 am GMT)
What can we expect from GBP today?
Today, Tuesday, the pound is trading broadly sideways just above the mid‑1.33s against the dollar, consolidating after recent gains and an 8‑week high last week. Markets are focused on UK labour‑market data due this morning and the approaching BoE meeting, where a 25 bp rate cut is almost fully priced following weak October GDP and softer‑than‑expected inflation, which together are capping sterling’s upside.
Central Bank Notes:
- The Bank of England’s Monetary Policy Committee (MPC) met on 6 November 2025 and voted 7–2 to keep the Bank Rate unchanged at 4.00 percent for a second consecutive meeting. The decision reflects the Committee’s cautious approach as inflation remains above target, but underlying economic momentum continues to weaken. Two members maintained their votes for a 25-basis-point cut, citing further signs of labor-market softening and weak business sentiment.
- The BOE adjusted its guidance on quantitative tightening (QT), maintaining the reduced pace established in September. The planned reduction of UK government bond holdings remains at £67.5 billion over the next 12 months, leaving the current gilt balance near £550 billion. Policymakers described the recalibrated QT path as “appropriate for current market conditions,” emphasizing the importance of liquidity management amid heightened volatility.
- Headline inflation moderated slightly to 3.6 percent in October from 3.8 percent previously, driven by easing food and transport prices. However, core inflation has shown only gradual progress, holding near 3.9 percent. The MPC noted that services inflation and administered energy costs continue to exert pressure, highlighting the challenge of achieving the 2 percent target sustainably. The Committee’s latest projections see inflation falling toward 3 percent by mid-2026, with further downside expected if energy and wage dynamics continue to normalize.
- Economic activity remains subdued. Estimates place Q3 GDP growth close to zero, with both business output and consumer spending restrained. The unemployment rate has edged up to 4.8 percent, while pay growth cooled to just under 5 percent year-on-year. MPC members acknowledged that pay settlements are weakening further, signaling an easing in labor cost pressures as demand softens. Surveys from the manufacturing and services sectors suggest muted hiring intentions through year-end.
- International factors continue to complicate the policy outlook. Fluctuating oil prices—partly linked to renewed Middle East tensions—alongside fragile global demand have contributed to higher market volatility. The MPC reiterated that external shocks, including global food and energy disruptions, could temporarily slow the disinflation path but remain unlikely to derail the medium-term moderation in prices.
- The Committee assessed risks around inflation as balanced. Downside risks arise from sluggish domestic growth and declining real income momentum, while upside risks remain tied to elevated inflation expectations and stubborn services inflation. Policymakers emphasized the need for patience, maintaining that any rate cuts ahead of clear inflation progress could undermine confidence in policy credibility.
- The MPC’s overall stance remains restrictive but increasingly balanced, with future moves expected to follow a cautious, data-driven trajectory. The Committee reaffirmed that monetary policy will stay tight until there is compelling evidence that inflation is returning to the 2 percent target on a durable basis.
- The next meeting is on 18 December 2025.
Next 24 Hours Bias
Medium Bullish
The Canadian Dollar (CAD)
Key news events today
BOC Gov Macklem Speaks (5:45 pm GMT)
What can we expect from CAD today?
The Canadian dollar is slightly softer on the day but continues to trade near its strongest levels in about three months, with USD/CAD hovering around 1.377–1.378 as markets mark time ahead of key US labor and activity data releases later today. The recent CAD strength reflects a combination of a softer US dollar on growing Fed‑cut expectations, relatively resilient Canadian growth, and inflation that is close enough to target for the Bank of Canada to pause while still sounding somewhat more hawkish than the Fed at the margin.
Central Bank Notes:
- The Council noted that U.S. tariff tensions have eased slightly following early progress in bilateral discussions, though the external trade environment remains fragile. Businesses continue to hold back on long-term investment, with the Bank highlighting that sustained clarity on U.S. trade policy is needed to restore confidence.
- The Bank acknowledged that uncertainty persists despite the softer U.S. tone, as incoming data show limited improvement in export orders. The manufacturing sector has stabilized but remains below pre-2024 output levels, reflecting weak global demand and cautious corporate spending.
- Canada’s economy showed tentative signs of recovery in early Q4, with GDP estimated to expand by 0.3% in October after two quarters of contraction. Mining and energy activity strengthened modestly, aided by steady crude demand, while goods exports posted a fractional gain.
- Service sector growth remained uneven, supported mainly by tourism-related and technology services. However, retail spending and household consumption were subdued, constrained by slower job creation and lingering consumer caution. The Bank judged overall momentum as fragile but improving marginally.
- Housing activity showed modest reacceleration in major urban markets as mortgage rates stabilized near record lows. Nonetheless, affordability pressures and stricter lending standards continue to limit overall resale volumes, resulting in only a gradual recovery in the housing sector.
- Headline CPI inflation rose to 2.1% in October, reaching the Bank’s target for the first time in six months. Higher energy prices and a modest uptick in food and shelter costs drove the increase. Core inflation measures remained stable, suggesting underlying price pressures are contained.
- The Governing Council reiterated its data-dependent stance, indicating that the current policy rate remains appropriate amid tentative growth and balanced inflation risks. Officials noted that while additional stimulus is not ruled out, the emphasis has shifted toward monitoring the sustainability of the recovery rather than immediate rate adjustments.
- The next meeting is on 17 to 18 December 2025.
Next 24 Hours Bias
Medium Bullish
Oil
Key news events today
API Crude Oil Stock (8:30 pm GMT)
What can we expect from Oil today?
Oil markets are on the back foot today as traders fade geopolitical risk and refocus on a looming supply overhang. Brent and WTI are extending Monday’s declines, trading near 60 and 56 USD respectively, with price action driven by improving odds of a Russia‑Ukraine ceasefire, which could normalize Russian exports, alongside softer China data that undercuts the demand outlook. Against a backdrop where OPEC is signaling steady demand but the IEA warns of a sizable 2026 surplus, rallies are being sold, and the curve reflects a market wrestling with record or near‑record demand but even faster supply growth, keeping crude pinned near multi‑year lows for now.
Next 24 Hours Bias
Medium Bearish
The post IC Markets Global – Europe Fundamental Forecast | 16 December 2025 first appeared on IC Markets | Official Blog.
Tuesday 16th December 2025: Asian Markets Slide on Wall Street Weakness Ahead of Key U.S. Economic Data
December 16, 2025 15:00 ICMarkets Market News
Global Markets:
- Asian Stock Markets : Nikkei down -1.24%, Shanghai Composite down -1.22%, Hang Seng down -1.98% ASX down -0.46%
- Commodities : Gold at $4,311.20 (-0.56%), Silver at $62.360 (-1.98%), Brent Oil at $60.21 (-0.59%), WTI Oil at $59.35 (-0.58%)
- Rates : US 10-year yield at 4.170, UK 10-year yield at 4.5020, Germany 10-year yield at 2.8508
News & Data:
- (CAD) CPI m/m 0.1% to 0.1% expected
- (CAD) Median CPI y/y 2.8% to 2.9% expected
- (CAD) Trimmed CPI y/y 2.8% to 2.9% expected
Markets Update:
Asian stock markets are trading mostly lower on Tuesday, tracking broadly negative cues from Wall Street overnight, as continued weakness in energy and technology stocks weighs on sentiment. Uncertainty surrounding future AI spending and fears of a potential tech bubble have made investors cautious, while traders are also reluctant to take large positions ahead of key U.S. economic data releases later this week, including retail sales and inflation figures. Asian markets had ended mostly lower on Monday.
The upcoming data could influence expectations for interest rates following the U.S. Federal Reserve’s policy decision last week. Although the Fed delivered a widely expected quarter-point rate cut, its projections revealed sharp divisions among policymakers over the pace and extent of further easing.
In Australia, the stock market is trading modestly lower after an early uptick, extending the previous session’s losses amid weakness in energy and technology shares. The benchmark S&P/ASX 200 is hovering below the 8,650 level, with mixed performances across other sectors. Mining stocks are mixed, oil stocks are broadly weaker, while gold miners are mostly higher. Banking shares are narrowly mixed, and tech stocks remain under pressure.
In Japan, stocks are sharply lower, with the Nikkei 225 slipping below the 49,800 level as losses in heavyweight, exporter, and banking stocks drag the market down. Elsewhere in Asia, most major markets are also lower.
On Wall Street, U.S. stocks finished modestly lower on Monday after early gains faded, while European markets traded mostly higher. Crude oil prices declined on oversupply concerns.
Upcoming Events:
- 01:30 PM GMT – USD Core Retail Sales m/m
- 01:30 PM GMT – USD Non-Farm Employment Change
- 01:30 PM GMT – USD Retail Sales m/m
- 01:30 PM GMT – USD Unemployment Rate
The post Tuesday 16th December 2025: Asian Markets Slide on Wall Street Weakness Ahead of Key U.S. Economic Data first appeared on IC Markets | Official Blog.
UK October ILO unemployment rate 5.1% vs 5.1% expected
December 16, 2025 14:14 Forexlive Latest News Market News
- Prior 5.0%
- Employment change -17k vs -67k expected
- Prior -22k
- Average weekly earnings +4.7% vs +4.4% 3m/y expected
- Prior +4.8%; revised to +4.9%
- Average weekly earnings (ex bonus) +4.6% vs +4.5% 3m/y expected
- Prior +4.6%; revised to +4.7%
- November payrolls change -38k
- Prior -32k; revised to -22k
The jobless rate in the UK continues to tick higher, with payrolls change for November also declining once more. That continues to reinforce a softening labour market picture, though wages are holding up somewhat still. The BOE will have to be mindful with the unemployment rate creeping up to its highest since February 2021. Meanwhile, the UK employment rate is seen dropping further to 74.9% – down 0.3% on the quarter and keeping well below its pre-pandemic levels.
Real wages (after accounting for CPI) is seen declining but just marginally, with total pay seen at 0.7% and regular pay 0.5% in real-terms in the three months to September.
As for payrolls in general, we are seeing the number of payrolled employees continuing to fall further and now reach its lowest since September 2023.
The data continues to underscore that the UK jobs market is softening and will keep the pressure on the BOE to cut rates down the road. A 25 bps rate cut for this week is very likely, even if the voting intentions might be marginally in favour of a rate cut. The market is pricing in ~92% odds of a move on Thursday.
This article was written by Justin Low at investinglive.com.
Reminder: US jobs data will be due today
December 16, 2025 11:39 Forexlive Latest News Market News
So, what’d I miss during the break? 😉
There was no shortage of action in markets in the past week, not least with the Fed delivering one final 25 bps rate cut to wrap up the year. Now, the race for Fed chair is also reportedly heating up with Kevin Warsh pipped to be the favourite – ousting Hassett. A battle between the two Kevins is what’s left now.
But for today, the drama will center on the release of the much delayed US labour market report. That’s right. The non-farm payrolls data for November was not released on the first week of December but instead pushed to today. And to make things more complicated, it will be combined with the October job numbers as well.
If that is already not messy enough for you, the BLS also announced that there will be “higher-than-usual variances” in the jobs data for this month and following months as well.
This comes as they implement statistical weighting changes to account for the missing October panel and also as November saw some data collection issues.
All of this just means it won’t be easy and it might take some time – not necessarily this week or this month – to read into the numbers and make sense of the labour market outlook. The existing narrative is that we should continue to see signs of weakening in the landscape, and it will make more sense for market players to judge that in early next year and not on this mess of a release.
Still, it doesn’t mean traders and investors will not react to the data and brush it aside. There will be volatility and reactions to it for sure. But if you’re expecting any firm conclusions from the numbers today, you might not want to hold your breath on that one.
In any case, headline non-farm payrolls for November is estimated at 50k with the jobless rate at 4.4%. So, those will remain key benchmark figures to be mindful of ahead of the release later.
This article was written by Justin Low at investinglive.com.
investingLive Asia-Pacific FX news wrap: Onshore yuan continues stronger
December 16, 2025 10:30 Forexlive Latest News Market News
- US suspends UK tech deal amid wider trade tensions (earlier Financial Times report)
- Indian rupee fresh record lows on flow pressure
- CBA sees February RBA rate hike as growth runs hot. Citi & NAB also expect February hike.
- NAB sees RBA hiking twice in 2026, clashing with market expectations for extended hold
- China eyes pragmatic 2026 growth target near 5% (while onshore yuan surges higher!)
- ICYMI – Ford takes US$19.5bn EV charge as strategy pivots to hybrids
- New Zealand fiscal outlook darkens as finance minister Willis sticks to discipline
- PBOC sets USD/ CNY reference rate for today at 7.0602 (vs. estimate at 7.0444)
- Japan preliminary December PMI shows modest growth as services offset factory weakness
- New Zealand bonds – NZDMO cuts near-term bond issuance but lifts medium-term outlook
- Australian consumer sentiment falls sharply in December: Westpac
- ECB/NFP preview – Morgan Stanley sees euro gain if ECB avoids rate pushback, 1.30 longterm
- Nasdaq moves toward 24/5 stock trading amid global demand
- Goldman Sachs raises its 2026 copper forecast as tariff odds ease
- Australia preliminary December PMI: Manufacturing 52.2 (prior 51.6) services 51.0 (52.8)
- New Zealand data: November Food Price Index -0.4% m/m (prior -0.3%)
- Tech stocks slide as Broadcom tumbles amid market turbulence
We saw a raft of lower-tier economic data released during the Asia session.
New Zealand kicked things off with data showing food price inflation falling on the month while remaining elevated year on year. The monthly decline in the Food Price Index will be welcomed by the Reserve Bank of New Zealand, offering tentative evidence that one of the stickier components of inflation may be starting to ease. With food prices accounting for nearly a fifth of the CPI basket, even modest monthly declines can have a meaningful impact on headline inflation outcomes.
Later from New Zealand, fresh fiscal projections showed no return to a budget surplus over the next five years, as weak growth and higher debt continue to delay fiscal repair. Net debt is now seen peaking at 46.9% of GDP, despite tentative signs of economic recovery. Separately, the New Zealand Debt Management Office trimmed its near-term bond issuance plans. The NZD was heavy for most of the session.
The AUD also softened before recovering modestly. Australian data showed the headline S&P Global Flash Composite PMI eased to 51.1 in December from 52.6 in November — a seven-month low, but still comfortably above the 50 expansion threshold, extending the growth run to fifteen consecutive months.
The moderation reflected slower momentum across both sectors. Services activity eased, with the Business Activity Index falling to 51.0 from 52.8 as heightened competition and softer export growth weighed. Manufacturing, by contrast, showed relative resilience, with the PMI rising to 52.2 from 51.6 on firmer goods demand and improved export orders.
We also heard from Commonwealth Bank of Australia and National Australia Bank, with analysts at both now expecting a Reserve Bank of Australia cash rate hike at the 2–3 February 2026 meeting. NAB further expects an additional hike in May ’26. AUD/USD dipped to just below 0.6620 before rebounding modestly toward 0.6635, with NZD/USD also ticking higher.
USD/JPY drifted lower, briefly testing below 154.75. Japan’s preliminary December PMI showed modest growth as services offset ongoing manufacturing weakness, with little else of note from the data.
In China, the PBOC once again set USD/CNY above model estimates at the daily fixing, though the market pushed the pair lower regardless, with USD/CNY hitting levels last seen in late September 2024. Meanwhile, China Securities Times reported policymakers are debating whether to set next year’s growth target at around 5% or adopt a more flexible 4.5%–5.0% range, underscoring a pragmatic approach amid a tougher external backdrop.
Asia-Pac
stocks were heavy, following a weak Wall Street:
- Japan
(Nikkei 225) -1.28% - Hong
Kong (Hang Seng) -1.88% - Shanghai
Composite -1.29% - Australia
(S&P/ASX 200) -0.41%
This article was written by Eamonn Sheridan at investinglive.com.
US suspends UK tech deal amid wider trade tensions (earlier Financial Times report)
December 16, 2025 10:30 Forexlive Latest News Market News
The United States has suspended a recently agreed technology partnership with Britain, injecting fresh uncertainty into the transatlantic relationship as Washington presses London for broader trade concessions beyond the tech sector.
According to reporting by the Financial Times, the U.S. administration halted progress on the so-called Tech Prosperity Deal last week, despite the agreement having been unveiled earlier this year as a flagship framework to deepen cooperation in artificial intelligence, quantum computing and civil nuclear energy. British officials have since confirmed the suspension, though neither government has formally commented.
The Financial Times is gated, but Reuters summarised the report.
The move appears to reflect growing frustration in Washington over what it views as the UK’s reluctance to address a range of non-tariff barriers, including regulatory and standards-based restrictions affecting food products and industrial goods. U.S. officials are said to be seeking concessions in these areas, signalling that the technology partnership has become entangled in wider trade negotiations.
The suspension underscores the increasingly transactional nature of U.S. trade policy under President Donald Trump, with sector-specific agreements now more tightly linked to broader market-access objectives. While the tech deal was framed as a strategic collaboration aimed at strengthening Western leadership in advanced technologies, it has become leverage in talks over trade frictions unrelated to digital policy.
The setback is notable given the scale of existing U.S.–UK economic ties. The United States is Britain’s largest trading partner, and major U.S. technology firms have already invested billions of dollars in UK operations across cloud computing, artificial intelligence research and data infrastructure. The UK has positioned itself as a key hub for emerging technologies, particularly as it seeks to differentiate its regulatory framework post-Brexit.
Although the suspension does not amount to a cancellation, it raises questions over the durability of bilateral tech cooperation if progress on trade issues stalls. Analysts note that prolonged delays could complicate investment decisions and slow joint initiatives in strategically sensitive areas such as AI governance and quantum research.
For now, the episode highlights how geopolitical considerations and trade disputes are increasingly intersecting with technology policy, turning once-standalone innovation partnerships into bargaining chips in broader economic negotiations.
This article was written by Eamonn Sheridan at investinglive.com.