Articles
Major European indices close the session with mixed results.Silver trades at all-time high
December 10, 2025 00:45 Forexlive Latest News Market News
European Indices End Mixed as Trading Winds Down
The major European stock indices closed the session mixed, with performance varying across the region. Germany’s DEU40 led to the upside, gaining 0.49% at 24,162.66, while France’s CAC40 lagged, falling 0.69% to 8,052.52. The UK’s FTSE 100 (UKX) hovered near unchanged levels, slipping just 0.03% to 9,642.00.
Spain’s market data included duplicate readings for the IBEX 35, both showing the index up 0.13% at 16,734.49, confirming a modest gain on the day. Italy’s FTMIB also posted a respectable rise of 0.33%, closing at 43,574.51.
U.S. stock indices are mixed as London and European traders call it a day
As European traders head for the exits, U.S. equities are mixed in early trading.
-
Dow Jones (DJI): 47,724.12, down 0.03%
-
S&P 500 (SPX): 6,854.43, up 0.12%
-
Nasdaq (IXIC): 23,588.28, up 0.18%
The modest moves reflect a cautious tone ahead of today’s Treasury auction and lingering macro uncertainty.
U.S. Treasury Yields head higher ahead of 10 year auction
The U.S. Treasury market is showing small upward moves in yields across much of the curve:
-
2-year: 3.6043% (+0.021 basis points)
-
5-year: 3.7691% (+0.017 basis points)
-
10-year: 4.1741% (unchanged)
-
30 year 4.800%, (-1.5 basis points)
Further out the curve, long-end yields dipped slightly, with the 20-year and 30-year down by 0.012 and 0.014 respectively.
A key focal point today will be the U.S. Treasury’s auction of $39 billion in 10-year notes at 1:00 PM ET, which could influence yield direction and risk sentiment into the afternoon session.
Commodities & Crypto: Silver Breaks Above $60 for the First Time Ever
The commodities complex is uneven, with crude oil under pressure while precious metals surge.
-
US Oil: $58.22, down 1.05%
-
Gold: $4,206.095, up 0.37%
-
Silver: $60.115 — up 3.40%, trading above $60 for the first time ever
-
Bitcoin: $93,727, up 3.40%
Silver’s breakout above the $60 mark marks a historic milestone, underscoring strong investment flows into precious metals as inflation hedges and volatility dampeners.
This article was written by Greg Michalowski at investinglive.com.
U.S. Economic Data Finally Resumes After Shutdown: Key CPI and Jobs Reports Rescheduled
December 9, 2025 23:39 Forexlive Latest News Market News
-
Government data releases are catching up following the 46-day shutdown.
-
November CPI arrives December 18, while December CPI and real earnings will be released on January 13.
-
January jobs report shifts to January 9, restoring a near-normal schedule for labor-market data.
As the government works its way out of the 46-day shutdown, the economic data calendar is finally beginning to realign. The BLS will release the delayed November CPI report on December 18, and has now scheduled the December CPI for January 13. On that same day, the agency will publish real earnings for December, helping fill in the inflation-adjusted income picture.
The U.S. Employment Situation report—normally released on the first Friday of each month—will instead arrive on Friday, January 9, roughly one week later than usual. That timing marks a return to a more typical rhythm for labor-market reporting, suggesting that at least the jobs calendar will be back on track as the backlog clears.
This article was written by Greg Michalowski at investinglive.com.
JOLTS October job openings 7.600M vs 7.150M estimate
December 9, 2025 22:14 Forexlive Latest News Market News
- Prior month 7.227M
- JOLTs job openings 7.670M vs 7.150M estimate
-
October hires were little changed, holding at 5.1 million.
-
The hire rate remained steady at 3.2%.
-
No significant hiring shifts occurred across any major industries
-
In October, total separations were little changed at 5.1 million and a 3.2% rate.
-
Total separations fell in health care & social assistance (-111,000) and the federal government (-34,000).
-
Quits in October were little changed at 2.9 million with a 1.8% rate.
-
Quits were down 276,000 over the year.
-
Quits decreased in:
-
Accommodation & food services (-136,000)
-
Health care & social assistance (-114,000)
-
Federal government (-25,000)
-
-
Federal government quits hit a series high of 46,000 in September.
-
Quits increased in:
-
Arts, entertainment & recreation (+38,000)
-
Information (+21,000)
-
The quits is at the lowest since 2020. That is indicative of a jobs market that has some anxiety. People tend to quit jobs when they are confident of getting another job. That is not the case now. However, it was for October in the midst of a shutdown
We saw initial jobless claims last week move below 200K. It was Thanksgiving week which can be influenced by seasonals but we will see. The ADP data today, saw a move back to positive after being negative more recently (with the ADP monthly coming in negative).
This article was written by Greg Michalowski at investinglive.com.
WH Economic Advisor Hassett: There is more room than a 25 basis point cut
December 9, 2025 22:00 Forexlive Latest News Market News
The White House economic advisor Hassett is speaking and says:
- Plenty of room for the Fed to cut rates
- Says that there is a play room to cut more than 25 basis points.
- Pres. Trump will make a choice but could change his mind
- Says that it’s important for the Fed chair to look at data.
- Says that Treasury Secretary Bessette is at the top was for running the Fed, but he does not want the job.
- If Fed chair, would make decisions based on his judgment. Says Trump trusts that.
- Labor growth is a little slower than it has been
What’s particularly interesting right now is the intense focus on economic data. Critics such as Miran and Bessent argue that the current Federal Reserve is not forward-looking enough, saying policymakers should be anticipating economic shifts rather than reacting to them. In contrast, Kevin Hassett’s is now aligning more closely with the Fed’s existing framework—including the oft criticized Chair Jerome Powell, who repeatedly emphasizes that the Fed remains data-dependent in setting policy.
Betting markets still support Hassett. On Polymarket, traders currently assign Hassett a 76% probability of becoming the next Fed leader—down from about 88% yesterday, but still firmly in the lead. Kevin Warsh, by comparison, sits at roughly 12%, suggesting market confidence remains strongly tilted toward Hassett despite recent volatility.
This article was written by Greg Michalowski at investinglive.com.
US to allow Nvidia H200 chip exports to China
December 9, 2025 20:39 Forexlive Latest News Market News
US is to allow Nvidia H200 chip exports to China.
- Some analysts view such a move as a “strategic win-win,” arguing that allowing H200 shipments would sustain China’s reliance on U.S. AI infrastructure — and potentially slow down the adoption of domestic alternatives
- The H200 is more capable than the chip China is currently allowed to buy (the H20), which gives it technical appeal for high-demand applications (large-model training, inference, data-center use cases)
Although good news, Jensen Huang, recently said he is not sure China would accept H200 even if restrictions are eased — Beijing may prefer home-grown chips or chips already certified under export rules. Chinese firms and regulators appear increasingly focused on domestic AI-chip makers (like Cambricon Technologies) and building self-sufficiency. There’s growing pressure—both economic and political—on companies not to rely solely on foreign hardware.
Nvidia shares have moved higher and are up $3.90 or 2.15% at $186.46.
This article was written by Greg Michalowski at investinglive.com.
Weekly ADP 4-week average employment change +4.75K versus -13.5K in last weekly release
December 9, 2025 20:30 Forexlive Latest News Market News
- Monthly ADP -32k
- Last weekly report -13.5K.
- The weekly 4-week average is 4.75K
From ADP:
For the four weeks ending November 22, 2025, U.S. private employers added an average of 4,750 jobs per week, according to the NER Pulse, a weekly update of the monthly ADP National Employment Report (NER).
Three times a month, ADP Research publishes preliminary estimates of the week-over-week change in U.S. employment based on a four-week moving average. These estimates are based on ADP’s finely tuned, high-frequency data. Data is seasonally adjusted and made available with a two-week lag.
This article was written by Greg Michalowski at investinglive.com.
investingLive European FX news wrap: JPY keeps weakening, Trump considering tariff changes
December 9, 2025 19:45 Forexlive Latest News Market News
- Trump: May make tariff changes to lower some prices
- US November NFIB small business optimism index 99.0 vs 98.3 expected
- China set to limit access to Nvidia’s H200 chips – FT
- ECB’s Nagel: AI offers tools to process vast datasets and can improve predictive accuracy
- The JPY is free-falling again despite incoming BoJ rate hike and constant jawboning
- BoJ Governor Ueda: Believe the economy will go back to positive growth in Q4 and beyond
- Germany October trade balance €16.9 billion vs €15.6 billion expected
- FX option expiries for 9 December 10am New York cut
- Japan PM Takaichi: Specifics of monetary policy up to BoJ
- BoJ Governor Ueda: Certainty of BoJ’s outlook materialising is increasing gradually
- What are the main events for today?
- Japan PM Takaichi: Will take appropriate actions on FX if necessary
- investingLive Asia-pacific market news wrap: RBA introduces a clear hawkish bias
- RBA’s Bullock: If data suggests inflation not slowing, that will be considered in February
The most notable mover in the session was the Japanese Yen. The JPY continues to weaken across the board despite the incoming BoJ rate hike and constant jawboning from Japanese officials.
Part of the problem could be that the BoJ waited far too long and it’s now looking to deliver a cautious rate hike right when other major central banks are shifting to a hawkish stance.
The market has also already priced in a rate hike this month and at very least another in 2026, so it’s hard to see the BoJ outhawking the market pricing, leaving limited room for JPY appreciation on a hawkish repricing.
We also got a report from Financial Times saying that Chinese regulators have been discussing ways to permit limited access to H200 chips. No final decision had been made yet though. For context, Trump yesterday announced that the US will allow Nvidia to sell H200 chips to China.
US equity indices weakned a bit on the headline but recovered quickly as this news isn’t new. In fact, China has been implementing restrictions on foreign AI chips like Nvidia, AMD and so on in state-funded data centers to boost domestic tech as they compete with the US.
Lastly, Politico published an interview with Trump in which he said that he may consider changes to tariffs to lower prices. He also said that the willingness to lower interest rates would be a litmus test in the choice of a new Fed chair.
Lowering tariffs further would be certainly bullish for the global economy but at this point it could also stoke inflation given that central banks responded to the negative shock from tariffs with lower interest rates. Therefore, it might be bullish in the short-term but if things get hot, central banks will be forced to tighten again, and that would be negative for risk assets.
This article was written by Giuseppe Dellamotta at investinglive.com.
Trump: May make tariff changes to lower some prices
December 9, 2025 18:30 Forexlive Latest News Market News
- Would make support for immediately slashing interest rates as a litmus test in the choice of a new Fed chair (well, duh)
- Ukrain hasn’t had an election in a long time
- No question Russia has a stronger position
- On Ukraine: Europe is not handling it well
- Trump declined to rule out troops in Venezuela
- Could extend anti-drug military operations to Mexico and Colombia
This article was written by Giuseppe Dellamotta at investinglive.com.
US November NFIB small business optimism index 99.0 vs 98.3 expected
December 9, 2025 18:14 Forexlive Latest News Market News
- Prior 98.2
- Full report here
An increase in those expecting real sales to be higher contributed most to the rise in the Optimism Index. The Uncertainty Index rose 3 points from October to 91. An increase in owners reporting uncertainty about capital expenditure plans over the next three to six months was the primary driver of the rise in the Uncertainty Index.
NFIB Chief Economist Bill Dunkelberg said: “Although optimism increased, small business owners are still frustrated by the lack of qualified workers. Despite this, more firms still plan to create new jobs in the near future.”
This article was written by Giuseppe Dellamotta at investinglive.com.
Ex-Dividend 10/12/2025
December 9, 2025 17:14 ICMarkets Market News
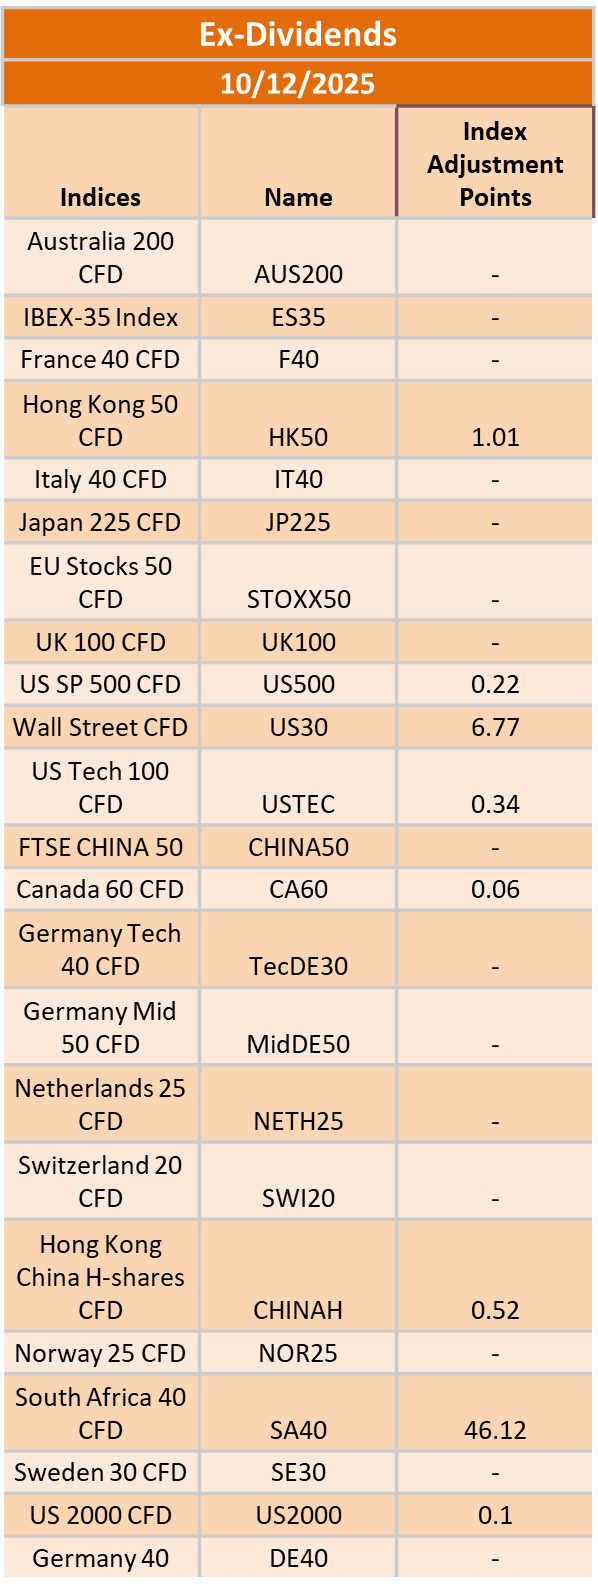
The post Ex-Dividend 10/12/2025 first appeared on IC Markets | Official Blog.
General Market Analysis – 9/12/25
December 9, 2025 16:00 ICMarkets Market News
US Stocks Ease Ahead of the Fed Meeting – Dow off 0.45%
US markets eased lower in the latest session as traders grew increasingly wary ahead of this week’s crucial Federal Reserve decision. With fears rising that the Fed may deliver a less dovish message than markets have priced in, risk appetite faded and equities shifted into reverse. The Dow led the declines, slipping 0.45% to 47,739, while the S&P 500 dipped 0.35% to 6,846, and the Nasdaq edged 0.14% lower to 23,545. The shift in expectations pushed the US dollar and Treasury yields higher once again; the DXY gained 0.12% to 99.10, while yields climbed across the curve, with the US 2-year rising 1.5 bps to 3.575% and the 10-year gaining 2.9 bps to 4.164%. Oil prices fell after reports confirmed Iraq had restored output at one of the world’s largest oilfields. Brent dropped 1.96% to $62.50, and WTI fell 2.05% to $58.65 a barrel. Gold also drifted lower, slipping 0.19% to $4,189.23 as higher yields and a stronger dollar reduced investor demand.
Dollar in Focus for FX Traders This Week
In a week full of interest rate calls from some major central banks, there is no doubt about which one will have the biggest effect on the major currency pairs. The RBA, Bank of Canada, and SNB will clearly have impacts on their respective currencies, and there will be good trading opportunities on the crosses, but for the majors, the Fed is likely to dominate moves into the year end and into 2026. Some market players are calling this one of the most contentious Fed meetings in recent times, with updates from various Fed members over the last few weeks adding much fuel to that fire. If we do get the expected cut, the forward guidance that we get from the Dot Plot, Statement, and Jerome Powell’s subsequent press conference will be key, with the risk probably still sitting with a much less dovish FOMC for 2026 than the market is expecting and stock markets are hoping for.
Event Calendar Kicks into Action
Today marks the start of a busy few days on the macro front, with key updates from central banks and data due across all three trading sessions. The Reserve Bank of Australia kicks off a packed week of central bank activity in the Asian session today; the market is firmly expecting rates to remain on hold, but traders are expecting plenty of volatility around the statement and press conference. Attention then shifts to Europe, where Bank of Japan Governor Kazuo Ueda speaks in London, before the Bank of England’s Monetary Policy Report Hearings later in the day, both events likely to spark moves in their respective currencies. The New York session sees the first major update out of the US for the week, with the JOLTS job openings data due out for both September and October, with the data offering another key insight into labour market tightness ahead of the Fed.
The post General Market Analysis – 9/12/25 first appeared on IC Markets | Official Blog.
Tuesday 9th December 2025: Technical Outlook and Review
December 9, 2025 15:39 ICMarkets Market News
DXY (U.S. Dollar Index):
Potential Direction: Bullish
Overall momentum of the chart: Bearish
The price could see a short-term pullback toward the pivot before rising again toward the 1st resistance.
Pivot: 99.00
Supporting reasons: Identified as a pullback support, where renewed buying pressure could emerge to push the price higher.
1st support: 98.67
Supporting reasons: Identified as an overlap support, indicating a potential area where the price could again stabilize.
1st resistance: 99.47
Supporting reasons: Identified as an overlap resistance, indicating a potential area that could halt any further upward movement
EUR/USD:
Potential Direction: Bearish
Overall momentum of the chart: Bearish
The price could see a short-term pullback toward the pivot before rising again toward the 1st resistance.
Pivot: 1.1644
Supporting reasons: Identified as a pullback resistance, where selling pressures could intensify and potentially cap any upward retracement.
1st support: 1.1590
Supporting reasons: Identified as an overlap support that aligns with the 50% Fibonacci retracement, indicating a potential level where the price could stabilize once again.
1st resistance: 1.1679
Supporting reasons: Identified as a swing high resistance, indicating a potential level that could cap further upward movement.
EUR/JPY:
Potential Direction: Bullish
Overall momentum of the chart: Bullish
The price could see a short-term pullback toward the pivot before rising again toward the 1st resistance.
Pivot: 179.93
Supporting reasons: Identified as an overlap support, where renewed buying pressure could emerge to push the price higher.
1st support: 178.67
Supporting reasons: Identified as a pullback support that aligns with the 50% Fibonacci retracement, indicating a potential area where the price could again stabilize.
1st resistance: 181.69
Supporting reasons: Identified as a swing high resistance, indicating a potential level that could cap further upward movement.
EUR/GBP:
Potential Direction: Bearish
Overall momentum of the chart: Bullish
The price has already reacted off the pivot and may continue its bearish move toward the 1st support.
Pivot: 0.8749
Supporting reasons: Identified as an overlap resistance that aligns with the 38.2% Fibonacci retracement, where selling pressures could intensify and potentially cap any upward retracement.
1st support: 0.8708
Supporting reasons: Identified as a pullback support that aligns closely with the 161.8% Fibonacci extension, indicating a potential area where the price could stabilize once more.
1st resistance: 0.8779
Supporting reasons: Identified as a pullback resistance, indicating a potential level that could cap further upward movement.
GBP/USD:
Potential Direction: Bullish
Overall momentum of the chart: Bullish
The price could see a short-term pullback toward the pivot before rising again toward the 1st resistance.
Pivot: 1.3262
Supporting reasons: Identified as a pullback support, where renewed buying pressure could emerge to push the price higher.
1st support: 1.3162
Supporting reasons: Identified as a pullback support, indicating a potential area where the price could stabilize once more.
1st resistance: 1.3370
Supporting reasons: Identified as an overlap resistance, indicating a potential level that could halt further upward movement.
GBP/JPY:
Potential Direction: Bullish
Overall momentum of the chart: Bullish
The price could see a short-term pullback toward the pivot before rising again toward the 1st resistance.
Pivot: 207.17
Supporting reasons: Identified as an overlap resistance, where selling pressures could intensify and potentially cap any upward retracement
1st support: 20532
Supporting reasons: Identified as an overlap support, indicating a potential level where the price could stabilize once more.
1st resistance: 208.26
Supporting reasons: Identified as a resistance that is supported by the 100% Fibonacci projection, indicating a potential level that could halt further upward movement.
USD/CHF:
Potential Direction: Bullish
Overall momentum of the chart: Bearish
The price could see a short-term pullback toward the pivot before rising again toward the 1st resistance.
Pivot: 0.8038
Supporting reasons: Identified as a pullback support, where renewed buying pressure could emerge to push the price higher.
1st support: 0.7987
Supporting reasons: Identified as a pullback support that aligns with the 50% Fibonacci retracement, indicating a potential level where the price could stabilize once again.
1st resistance: 0.8098
Supporting reasons: Identified as a swing high resistance, indicating a potential level that could cap further upward movement.
USD/JPY:
Potential Direction: Bearish
Overall momentum of the chart: Bullish
The price could see a short-term pullback toward the pivot before continuing its bearish move down toward the 1st support.
Pivot: 156.20
Supporting reasons: Identified as an overlap resistance that aligns with the 50% Fibonacci retracement, where selling pressures could intensify and potentially cap any upward retracement.
1st support: 154.44
Supporting reasons: Identified as an overlap support, indicating a strong area where buyers might return, and the price could stabilize once again.
1st resistance: 157.61
Supporting reasons: Identified as a swing high resistance. This level represents the next key area where upward movement could be capped amid increased selling pressure
USD/CAD:
Potential Direction: Bearish
Overall momentum of the chart: Bearish
The price could see a short-term pullback toward the pivot before continuing its bearish move down toward the 1st support.
Pivot: 1.3890
Supporting reasons: Identified as a pullback resistance, where selling pressures could intensify and potentially cap any upward retracement.
1st support: 1.3733
Supporting reasons: Identified as a swing low support, indicating a key level where the price could stabilize once more.
1st resistance: 1.3974
Supporting reasons: Identified as an overlap resistance, making it a possible target for bullish advances and a level where some sellers could return to cap gains
AUD/USD:
Potential Direction: Bullish
Overall momentum of the chart: Bullish
The price could see a short-term pullback toward the pivot before rising again toward the 1st resistance.
Pivot: 0.6611
Supporting reasons: Identified as a pullback support, where renewed buying pressure could emerge to push the price higher.
1st support: 0.6572
Supporting reasons: Identified as a pullback support, this area has provided strong support historically and may attract buying interest for a potential short-term bounce
1st resistance: 0.6684
Supporting reasons: Identified as an overlap resistance that aligns with the 161.8% Fibonacci extension, indicating a potential area that could halt any further upward movement.
NZD/USD
Potential Direction: Bullish
Overall momentum of the chart: Bullish
The price could see a short-term pullback toward the pivot before rising again toward the 1st resistance.
Pivot: 0.5743
Supporting reasons: Identified as a pullback support, where renewed buying pressure could emerge to push the price higher.
1st support: 0.5689
Supporting reasons: Identified as a pullback support, this area has provided strong support historically and may attract buying interest for a potential short-term bounce
1st resistance: 0.5797
Supporting reasons: Identified as an overlap resistance, indicating a potential area that could halt any further upward movement.
US30 (DJIA):
Potential Direction: Bullish
Overall momentum of the chart: Bullish
The price could see a short-term pullback toward the pivot before rising again toward the 1st resistance.
Pivot: 47,380.80
Supporting reasons: Identified as a pullback support, where renewed buying pressure could emerge to push the price higher.
1st support: 46,847.73
Supporting reasons: Identified as a pullback support that aligns with the 50% Fibonacci retracement, suggesting a potential area where the price could stabilize once again.
1st resistance: 48,426.81
Supporting reasons: Identified as a swing high resistance that aligns with the 61.8% Fibonacci projection, indicating a potential area that could halt any further upward movement.
DE40 (DAX):
Potential Direction: Bullish
Overall momentum of the chart: Bullish
The price could see a short-term pullback toward the pivot before rising again toward the 1st resistance.
Pivot: 23,868.59
Supporting reasons: Identified as a pullback support, where renewed buying pressure could emerge to push the price higher.
1st support: 23,488.00
Supporting reasons: Identified as a pullback support, indicating a key level where the price could stabilize once more.
1st resistance: 24,444.50
Supporting reasons: Identified as a swing high resistance that aligns with the 100% Fibonacci projection, indicating a potential area that could halt any further upward movement.
US500 (S&P 500):
Potential Direction: Bullish
Overall momentum of the chart: Bullish
The price could see a short-term pullback toward the pivot before rising again toward the 1st resistance.
Pivot: 6,773.23
Supporting reasons: Identified as a pullback support, where renewed buying pressure could emerge to push the price higher.
1st support: 6,673.25
Supporting reasons: Identified as an overlap support, indicating a potential level where the price could stabilize once again.
1st resistance: 6,920.20
Supporting reasons: Identified as a swing high resistance, indicating a potential area that could halt any further upward movement.
BTC/USD (Bitcoin):
Potential Direction: Bearish
Overall momentum of the chart: Bearish
The price could see a short-term pullback toward the pivot before continuing its bearish move down toward the 1st support.
Pivot: 94,626.34
Supporting reasons: Identified as an overlap resistance that aligns with the 50% Fibonacci retracement, where selling pressures could intensify and potentially cap any upward retracement.
1st support: 88,893.73
Supporting reasons: Identified as an overlap support, indicating a potential level where the price could stabilize once more.
1st resistance: 100,094.87
Supporting reasons: Identified as a pullback resistance, indicating a potential area that could halt any further upward movement.
ETH/USD (Ethereum):
Potential Direction: Bearish
Overall momentum of the chart: Bullish
The price could see a short-term pullback toward the pivot before continuing its bearish move down toward the 1st support.
Pivot: 3,230.74
Supporting reasons: Identified as an overlap resistance that aligns with the 61.8% Fibonacci retracement, where selling pressures could intensify and potentially cap any upward retracement.
1st support: 2,904.01
Supporting reasons: Identified as a pullback support, indicating a potential level where the price could stabilize once more.
1st resistance: 3,675.59
Supporting reasons: Identified as an overlap resistance, indicating a potential area that could halt any further upward movement.
WTI/USD (Oil):
Potential Direction: Bearish
Overall momentum of the chart: Bullish
The price could see a short-term pullback toward the pivot before rising again toward the 1st resistance.
Pivot: 59.47
Supporting reasons: Identified as a pullback resistance, where selling pressures could intensify and potentially cap any upward retracement.
1st support: 57.63
Supporting reasons: Identified as an overlap support, indicating a key level where the price could stabilize once more.
1st resistance: 61.09
Supporting reasons: Identified as an overlap resistance, indicating a potential area that could halt any further upward movement.
XAU/USD (GOLD):
Potential Direction: Bullish
Overall momentum of the chart: Bullish
The price could see a short-term pullback toward the pivot before rising again toward the 1st resistance.
Pivot: 4,149.19
Supporting reasons: Identified as a pullback support that aligns with the 50% Fibonacci retracement, where renewed buying pressure could emerge to push the price higher.
1st support: 4,083.34
Supporting reasons: Identified as a pullback support, indicating a key level where the price could stabilize once more.
1st resistance: 4,255.34
Supporting reasons: Identified as a swing high resistance, indicating a potential area that could halt any further upward movement.
The accuracy, completeness and timeliness of the information contained on this site cannot be guaranteed. IC Markets Global does not warranty, guarantee or make any representations, or assume any liability regarding financial results based on the use of the information in the site.
News, views, opinions, recommendations and other information obtained from sources outside of www.icmarkets.com, used in this site are believed to be reliable, but we cannot guarantee their accuracy or completeness. All such information is subject to change at any time without notice. IC Markets Global assumes no responsibility for the content of any linked site.
The fact that such links may exist does not indicate approval or endorsement of any material contained on any linked site. IC Markets Global is not liable for any harm caused by the transmission, through accessing the services or information on this site, of a computer virus, or other computer code or programming device that might be used to access, delete, damage, disable, disrupt or otherwise impede in any manner, the operation of the site or of any user’s software, hardware, data or property.
The post Tuesday 9th December 2025: Technical Outlook and Review first appeared on IC Markets | Official Blog.