Articles
The US treasury sells $13 billion of 20 year bonds at a high yield of 4.798%
December 18, 2025 01:14 Forexlive Latest News Market News
The U.S. Treasury sold $13 billion of 20 year bonds at a high yield of
- WI level at the time of the auction 4.799%
- Tail -0.1 bps vs 6 month average of -0.5 bps
- Bid to cover 2.67X vs 6 month average of 2.65X
- Dealers 12.57 vs 6 month average of 11.0%
- Directs 22.24% vs 6 month average of 25.3%
- Indirects 65.19% vs 6 month average of 63.7%
AUCTION GRADE: Given the results compared to the 6-month average, I give the auction an average grade of C. Not good. Not bad. Just average.
The 20-year Treasury bond occupies a unique and somewhat awkward position on the US yield curve compared to the “benchmark” 10-year and 30-year issues. It is often referred to by traders as an “orphan” issue.
1. The “Orphan” Status
Unlike the 10-year note (the global benchmark for risk-free rates) and the 30-year bond (the primary instrument for long-duration pension hedging), the 20-year bond lacks a natural, dedicated buyer base.
-
10-Year Role: Used by everyone—mortgage lenders, corporate bond pricers, and foreign central banks—as the primary reference point for the US economy.
-
30-Year Role: heavily favored by pension funds and insurance companies who need “long duration” assets to match their long-term liabilities (like payouts due in 30+ years).
-
20-Year Role: It falls in a “no man’s land.” It is too long for tactical traders who prefer the 10-year, but not “long enough” for pension funds who prefer the convexity and duration of the 30-year.
2. The Yield Anomaly (The 20s-30s Inversion)
Because of this “orphan” status, the 20-year bond typically trades with a liquidity premium, meaning investors demand a higher yield to hold it because it is harder to sell than a 10-year or 30-year bond.
This often results in a “kink” in the yield curve where the 20-year yield is near or even inverted to the 30-year yield.
This phenomenon occurs because demand for the 30-year is structurally higher (due to pensions), pushing its price up and its yield down, while the 20-year languishes with less demand, keeping its price lower and yield higher.
3. Liquidity and Trading
-
Volume: The 20-year bond sees significantly less trading volume than the 10-year and 30-year issues.
-
Volatility: Due to lower liquidity, the 20-year yield can be more volatile and prone to erratic moves during market stress compared to its neighbors.
Overview: The Auction Process
The US Department of the Treasury sells bills, notes, and bonds to finance the US government’s debt. These auctions are closely watched by traders (Forex, Equities, and Bond traders alike) because they provide a direct read on the demand for US assets and the direction of interest rates.
When the auction results are released, the market immediately compares the actual data against the “Pre-Auction” expectations.
Key Metrics for Auctions of US Treasuries.: A Bulleted Review
1. The WI Level (When-Issued Yield)
The “When-Issued” market is essentially a futures market for the Treasury security that is about to be auctioned. It trades in the days leading up to the auction and right up until the auction deadline.
-
The Benchmark: The WI yield at the exact time of the auction bidding deadline (1:00 PM ET) is the “expected” price.
-
The “Stop” (High Yield): This is the actual highest yield accepted by the Treasury to sell the entire auction amount.
-
The Tail: If the Auction Stop yield is higher than the WI yield, it is called a “Tail.” This is bearish (bad demand) because the Treasury had to offer a cheaper price (higher yield) than the market expected to get the deal done.
-
Stop-Through: If the Auction Stop yield is lower than the WI yield, it is a “Stop-Through.” This is bullish (strong demand) because buyers were willing to accept a lower yield than expected to secure the paper.
2. Bid-to-Cover Ratio
This is the primary measure of overall demand depth. It is calculated by dividing the total dollar amount of bids received by the amount of debt being sold.
-
Measurement: A ratio of 2.5 means there was $2.50 of demand for every $1.00 of debt sold.
-
Interpretation: A higher number indicates stronger demand. Traders usually compare today’s Bid-to-Cover against the “Six-Month Average” or the previous ten auctions to see if demand is rising or falling.
3. Indirect Bidders
These are buyers who place bids through a primary dealer rather than directly with the Treasury.
-
Who they are: This category is heavily dominated by Foreign Central Banks (via the Fed) and international investors.
-
Significance: This is widely viewed as a proxy for Foreign Demand. A strong Indirect number (e.g., 65% or higher) suggests that foreign entities remain confident in the US Dollar and US debt, which is generally supportive of the USD.
4. Direct Bidders
These are non-primary dealer institutions that place bids directly with the Treasury.
-
Who they are: Domestic money managers, hedge funds, pension funds, insurers, and occasionally individuals.
-
Significance: This is a proxy for Domestic Demand. If the Direct bid percentage rises, it often signals that US-based investment funds see value in the current yield levels.
5. Dealers (Primary Dealers)
Primary Dealers are large banks (like Goldman Sachs, JPMorgan, etc.) that are obligated to bid in Treasury auctions to ensure the debt gets sold.
-
Role: They act as the “backstop.” They buy whatever the Indirect and Direct bidders do not.
-
Interpretation: You generally want to see the Dealer award be low.
-
Low Dealer Award (e.g., <15%): Bullish. Real investors bought the debt, leaving the banks with very little “inventory” they have to sell later.
-
High Dealer Award (e.g., >25%): Bearish. Real investors didn’t show up, forcing the banks to absorb the supply. This creates “indigestion” because dealers will immediately try to sell that debt into the secondary market, pushing yields up.
-
This article was written by Greg Michalowski at investinglive.com.
US stock markets slump again as year-end selling continues
December 17, 2025 23:00 Forexlive Latest News Market News
It’s a tough time of year to try and make sense of market moves but I suspect we’re seeing profit taking and position squaring into year end. Some of the high-flying power-generation stocks are getting beaten up today and Oracle continues to crater. We also saw Tesla hitting all-time highs this week, which I suspect was at least partially due to short covering.
Nvidia, Google and Broadcom are all among the worst performers in the S&P 500 as well.
The S&P 500 is down 0.5% while the Nasdaq is down 0.8% in another sign of where the selling is coming from.
In terms of the short-covering angle, some of the best performers are Moderna, Service Now and Chipotle, all laggards this year.
So overall, I wouldn’t try to put any kind of macro or bigger stock market theme into the price action. I do suspect there is some real angst about AI and that could lead to some heavier tech selling at the turn of the year. For now though, this is flows not fundamentals.
This article was written by Adam Button at investinglive.com.
EIA weekly US crude oil inventories -1274K vs -1066K expected
December 17, 2025 22:39 Forexlive Latest News Market News
- Prior was -1812K
- Gasoline +4808K vs +2062K exp
- Distillates +1712K vs +1178K exp
There was a huge draw in the private data released yesterday, so ‘expectations’ were for something more-bullish than the consensus.
- Crude -9300K
- Gasoline -4800K
- Distillates +2500K
As a result, we’re getting some selling pressure on oil after the data. This is an unusually large divergence.
This article was written by Adam Button at investinglive.com.
China won’t need ASML’s chip-building machines for long
December 17, 2025 21:39 Forexlive Latest News Market News
The machine shown in this picture is probably the most-important one in the world. It’s from Dutch company ASML and it’s used to fabricate the most-precise computer chips.
Last year, the US began restricting their use and export into China.
Naturally, that caused some panic in Beijing and the country’s resources were marshalled at building a replacement. A report today from Reuters says they have at least partially succeeded. Citing sources, the report says researchers created a working prototype, not just now but in “early 2025” though it’s still undergoing testing and hasn’t produced a working chip.
That sounds a bit dubious but they’re extremely complicated machines. China’s aim is to produce its own chips by 2028.
If that’s the case, the US will then lose whatever moat it has in chips. The question is whether the US can be so far ahead in AI at that point that it won’t matter.
As for the market reaction, shares of ASML dipped on the headlines but it appears as though the market had largely priced in this development already.
This article was written by Adam Button at investinglive.com.
Funny how none of the Fed candidates are talking about the one-off drop in oil prices
December 17, 2025 21:00 Forexlive Latest News Market News
Fed Chair candidates are falling over themselves to explain how inflation really isn’t 2.8% y/y, as it was in the most-recent PCE report. They’re stripping out rent and portfolio management fees and tariffs to say that inflation is basically on target.
“Tariffs are not a source of persistent inflation,” candidate Chris Waller said today.
This is clearly an attempt to make the appropriate dovish talking points to please Trump. Now whether that charade continues after they actually get the job is anyone’s guess but time will tell.
Of course, the one-off factors swing both ways and that’s something they’re completely ignoring. WTI crude oil is down 23% year-to-date. That’s a big drag on inflation that will continue for a while as lower crude prices filter through.
But it won’t continue forever. If you’re watching oil company budgets this month, they’re being trimmed. No one is making money at $55 WTI and that’s going to do what low oil prices always do — cure low prices. Global oil demand continues to rise and the OPEC excess production will be trimmed and oil prices will inevitably rise again.
Of course, when crude prices do go up again, the same trio of Fed candidates will be ultra-quick to exclude energy costs in the PCE calculation. That won’t be a good look.
Ultimately though, the scorecard is what happens on inflation. We’ve just gone through a period of high prices that were a reminder to everyone of the costs. They were extremely disruptive and led to the topping of virtually every elected Western government; it also eroded faith in money and central banks. Still, it’s largely seen as a pandemic one-off. A repeat would be exponentially-more damaging and would risk unmooring inflation expectations for a generation.
In addition, there are other bubbles that are being formed by inflation that will take many years to unwind.
The Fed is traditionally the thought-leader of global central banks but it’s not clear there are enough people left to fight off inflation. We are also dealing with the breakdown of the global trading system and disruption of AI. How that impacts jobs, inflation and the economy is hard to predict but one thing that everyone in the economy should be able to rely on is sound money.
This article was written by Adam Button at investinglive.com.
investingLive European FX markets wrap: UK inflation cools just before BOE decision
December 17, 2025 20:30 Forexlive Latest News Market News
Headlines:
- UK November CPI +3.2% v +3.5% y/y expected
- British Pound drops across the board as UK inflation surprises to the downside
- GBP/USD on the rocks after softer UK inflation data today
- UK FTSE 100 Technical Analysis: Soft UK CPI boosts the stock market, BoE rate cut bets
- Japan bond yields continue to surge higher with eyes on the BOJ later this week
- BOJ should avoid premature rate hike, says ex-deputy governor
- Eurozone November final CPI +2.1% vs +2.2% y/y prelim
- Germany December Ifo business climate index 87.6 vs 88.2 expected
- After falling to a multi-year low, crude oil recovers on Venezuela, Russia sanctions news
- Japan visitor arrivals stay strong in November despite China boycott
Markets:
- USD leads, GBP lags on the day
- European equities higher; S&P 500 futures up 0.4%
- US 10-year yields up 2.5 bps to 4.174%
- Gold up 0.3% to $4,317.33
- WTI crude oil up 1.9% to $56.32
- Bitcoin down 0.9% to $87,040
The key risk event of the session came early on in the form of the UK inflation report. The numbers underwhelmed on estimates, reflecting softer price pressures and that led to a drop in sterling as UK stocks rallied.
Both the headline and core readings came in below expectations, with the details revealing a modest drop in food prices and core goods prices. The latter likely owes to heavy discounts on Black Friday sales but still, it’s enough to be quite a contrast to what we saw in November last year at least.
That being said, services inflation remains a sticking point as it continues to rest comfortably above 4%. The trend there is what will matter most for the BOE in the months ahead, so we’ll have to wait and see.
In any case, market players took to the report in solidifying expectations for a BOE rate cut tomorrow with perhaps quicker intentions for another to follow that up next year.
Prior to the UK inflation report, the next full 25 bps rate cut was priced in for July 2026. Now, that is bumped forward to April 2026. But looking out from now to the end of next year, there is ~69 bps of rate cuts priced in and that is not much changed from ~67 bps of rate cuts before the data. As such, that might put a floor on how much the pound might drop in the aftermath to all this.
GBP/USD fell from 1.3370 to 1.3311 before recovering a little to 1.3337 currently. The UK FTSE is putting in a solid shift in being up 1.5% on the day for now.
Besides that, the dollar was generally firmer in the major currencies space. EUR/USD is down 0.3% to 1.1715 with price action locked in between large option expiries at 1.1700 and 1.1750 on the day. Meanwhile, USD/JPY is seen higher by 0.5% to 155.50 levels as we see a solid rebound from below 155.00 yesterday.
In the equities space, European indices are keeping steadier and not all too much changed besides UK stocks. The DAX is flat while the CAC 40 is down 0.1%, so that’s not leaving much to work with. That despite US futures holding slight gains ahead of the open later. S&P 500 futures are up 0.3% on the day after a slow start earlier.
As for commodities, silver is continuing its hot streak with over 3% gains again today in a push to retest $66 earlier on. We’re seeing price keep around $65.85 for now, with the bullish run still sticking in December. Meanwhile, gold is also holding higher with 0.3% gains to $4,317 on the day.
This article was written by Justin Low at investinglive.com.
Eurozone November final CPI +2.1% vs +2.2% y/y prelim
December 17, 2025 17:14 Forexlive Latest News Market News
- Prior +2.1%
- Core CPI +2.4% vs +2.4% y/y prelim
- Prior +2.4%
The important point of the release is that core annual inflation is seen steady at 2.4%, unchanged from October. The main sticking point in terms of inflation pressures is still Germany and that represents a headache for the ECB, with it being the region’s largest economy. As such, they are forced to stay on the sidelines until pressures there moderate further.
At the same time, we did get the euro area wages and labour costs data for Q3. The former is seen at +3.0% year-on-year with the latter at +3.3% year-on-year. But as a reminder, negotiated wages in the euro area was seen at 1.87% in Q3 and that is down from 3.95% in Q2.
In any case, all of this just serves to reinforce the narrative that the ECB will remain on the sidelines for the time being. That at least until there is some meaningful change to the economic landscape, especially in Germany on inflation, as we look to next year.
EUR/USD continues to trade at 1.1717 in European morning trade, down 0.3% on the day. The pair continues to be boxed in by large option expiries at 1.1700 and 1.1750 with little conviction to go running before we get to US trading later.
This article was written by Justin Low at investinglive.com.
General Market Analysis – 17/12/25
December 17, 2025 17:00 ICMarkets Market News
US Stocks Mixed After Employment Update – Dow off 0.6%
US equity markets were mixed overnight as investors worked through delayed employment data released following the government shutdown, which delivered conflicting signals on labour market momentum. The Dow Jones fell 0.62% to close at 48,114, while the S&P 500 eased 0.24% to 6,800. In contrast, the Nasdaq edged 0.23% higher to finish at 23,111. Non-Farm Payrolls data had slumped sharply in October during the height of the shutdown before rebounding strongly in November to exceed most expectations. The DXY slipped 0.10% on the day to 98.21, having initially dropped harder on the initial data. In rates markets, the 2-year Treasury yield fell 1.4 basis points to 3.487%, while the 10-year lost 2.7 basis points to move back down to 4.145%. Oil prices took another step lower to hit levels not seen for nearly five years. Brent dropped 2.82% to $58.85 a barrel, while WTI slid 2.90% to $55.19. Markets continue to price in persistent oversupply into next year, while growing optimism around a potential peace agreement in Ukraine added further downside pressure. Gold was little changed on the session, easing 0.06% to $4,302.32 an ounce, though the metal continues to find solid support on dips amid the current macro environment.
Market Remains More Dovish than the Fed
Global markets remain much more dovish than the Fed in current conditions, with the overall market pricing in 58 basis points of rate cuts from the world’s biggest central bank in 2026, while the clear message from Jerome Powell was that the FOMC has just one 25 basis point cut on the calendar in the coming 12 months. Last night’s data had the market pricing in a chance of a hold in January more strongly, up to 75% from 70% before the numbers, but it is the divergence further out that could see moves in the market. Of course, a lot of the longer-dated market pricing has a new Chairman factored in who is likely to be more dovish, in line with the President’s wishes, so that situation is likely to add volatility in the coming months. We have key CPI data out tomorrow, and that could be telling for the shorter term, as we have clear indications from FOMC members that they consider inflation to be too sticky at the moment. If CPI remains at elevated levels, it could push those rate cut expectations further down the curve.
Quieter Calendar Day Ahead for Traders
Looking ahead, it is a relatively quiet day on the macroeconomic calendar today, though traders will be monitoring price action following the US overnight session and key data updates from there. There is little on the calendar in the Asian session today; however, UK markets will be back in focus early in the European session with key CPI data due out. Expectations are for a 3.5% year-on-year print, which is still high, just a day ahead of the crucial Bank of England rate call tomorrow. Germany’s IFO Business Climate survey is due out later in the session (exp. 88.2), but expect that UK data to dominate. In the US session, we have the usual weekly crude oil inventory data (exp. -2.4 mio) scheduled, but expect comments from Fed members Waller, Williams, and Bostic to move markets as we progress through the session.
The post General Market Analysis – 17/12/25 first appeared on IC Markets | Official Blog.
Wednesday 17th December 2025: Technical Outlook and Review
December 17, 2025 16:39 ICMarkets Market News
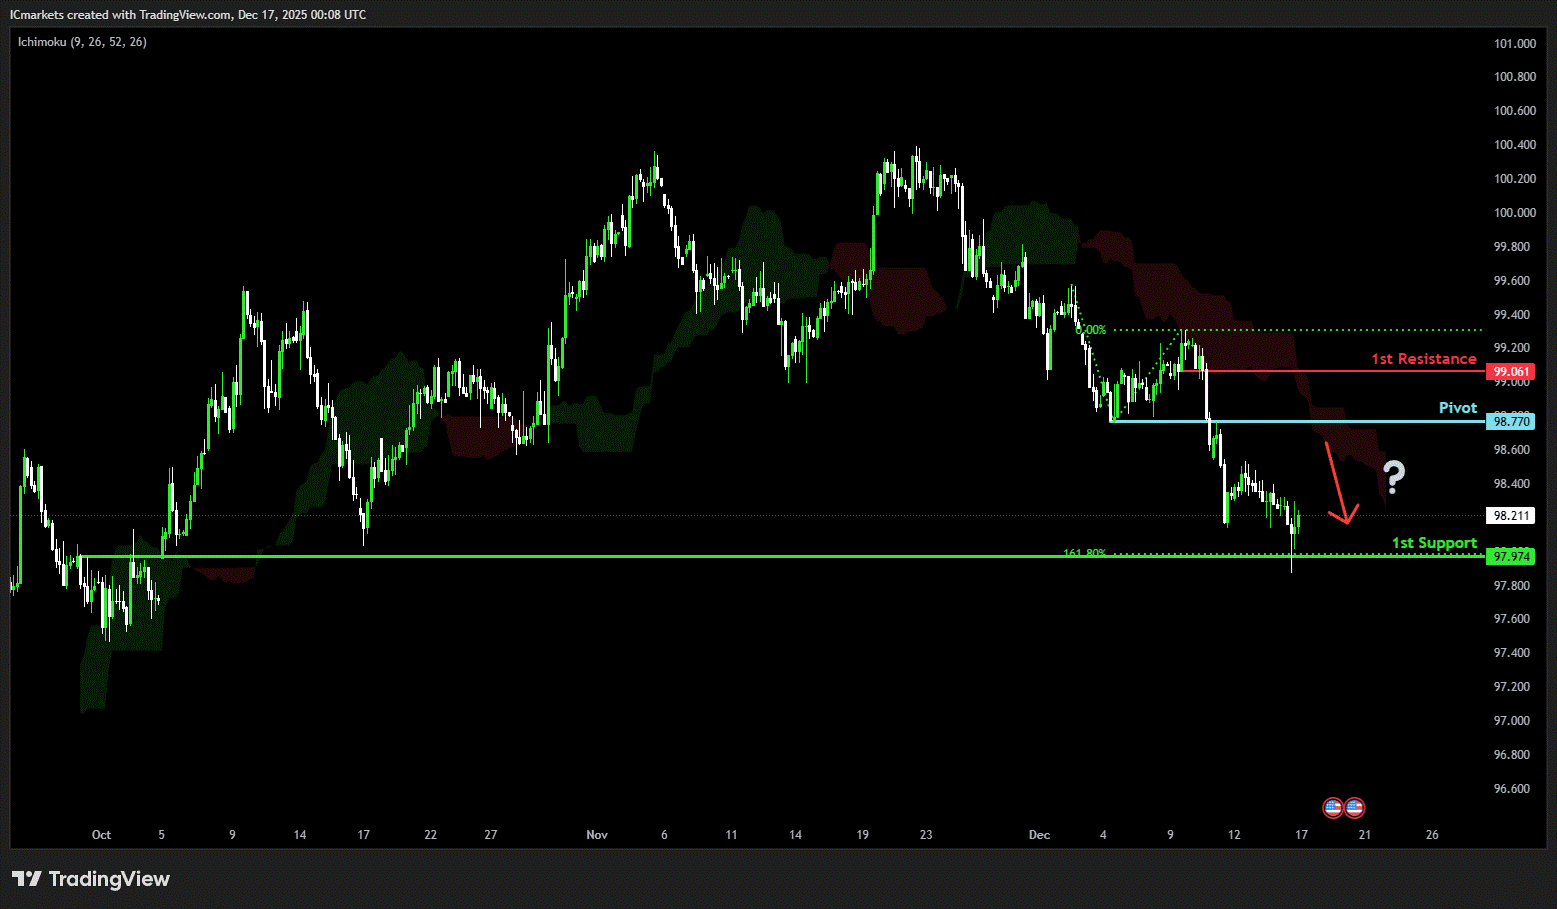
DXY (U.S. Dollar Index):
Potential Direction: Bearish
Overall momentum of the chart: Bearish
The price could see a short-term pullback toward the pivot before continuing its bearish move down toward the 1st support.
Pivot: 98.77
Supporting reasons: Identified as a pullback resistance, where selling pressures could intensify and potentially cap any upward retracement.
1st support: 97.97
Supporting reasons: Identified as an overlap support that aligns with the 161.8% Fibonacci extension, indicating a potential area where the price could again stabilize.
1st resistance: 99.06
Supporting reasons: Identified as a pullback resistance, indicating a potential area that could halt any further upward movement
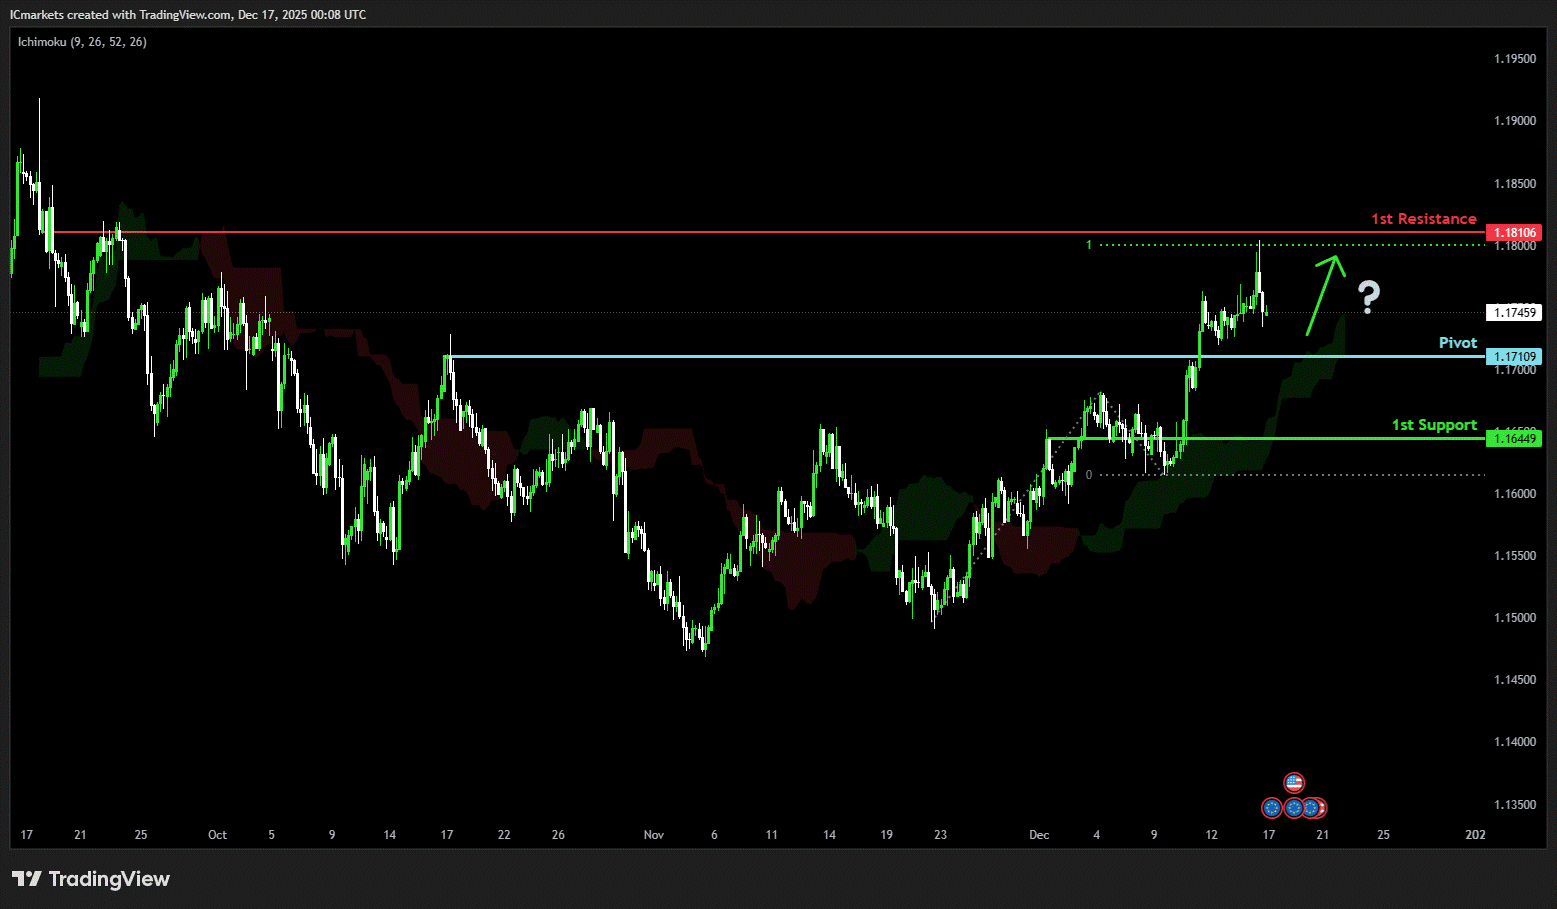
EUR/USD:
Potential Direction: Bullish
Overall momentum of the chart: Bearish
The price could see a short-term pullback toward the pivot before rising again toward the 1st resistance.
Pivot: 1.1710
Supporting reasons: Identified as a pullback support, where renewed buying pressure could emerge to push the price higher.
1st support: 1.1644
Supporting reasons: Identified as a pullback support, indicating a potential level where the price could stabilize once again.
1st resistance: 1.1810
Supporting reasons: Identified as a swing high resistance that aligns closely with the 100% Fibonacci projection, indicating a potential level that could cap further upward movement.
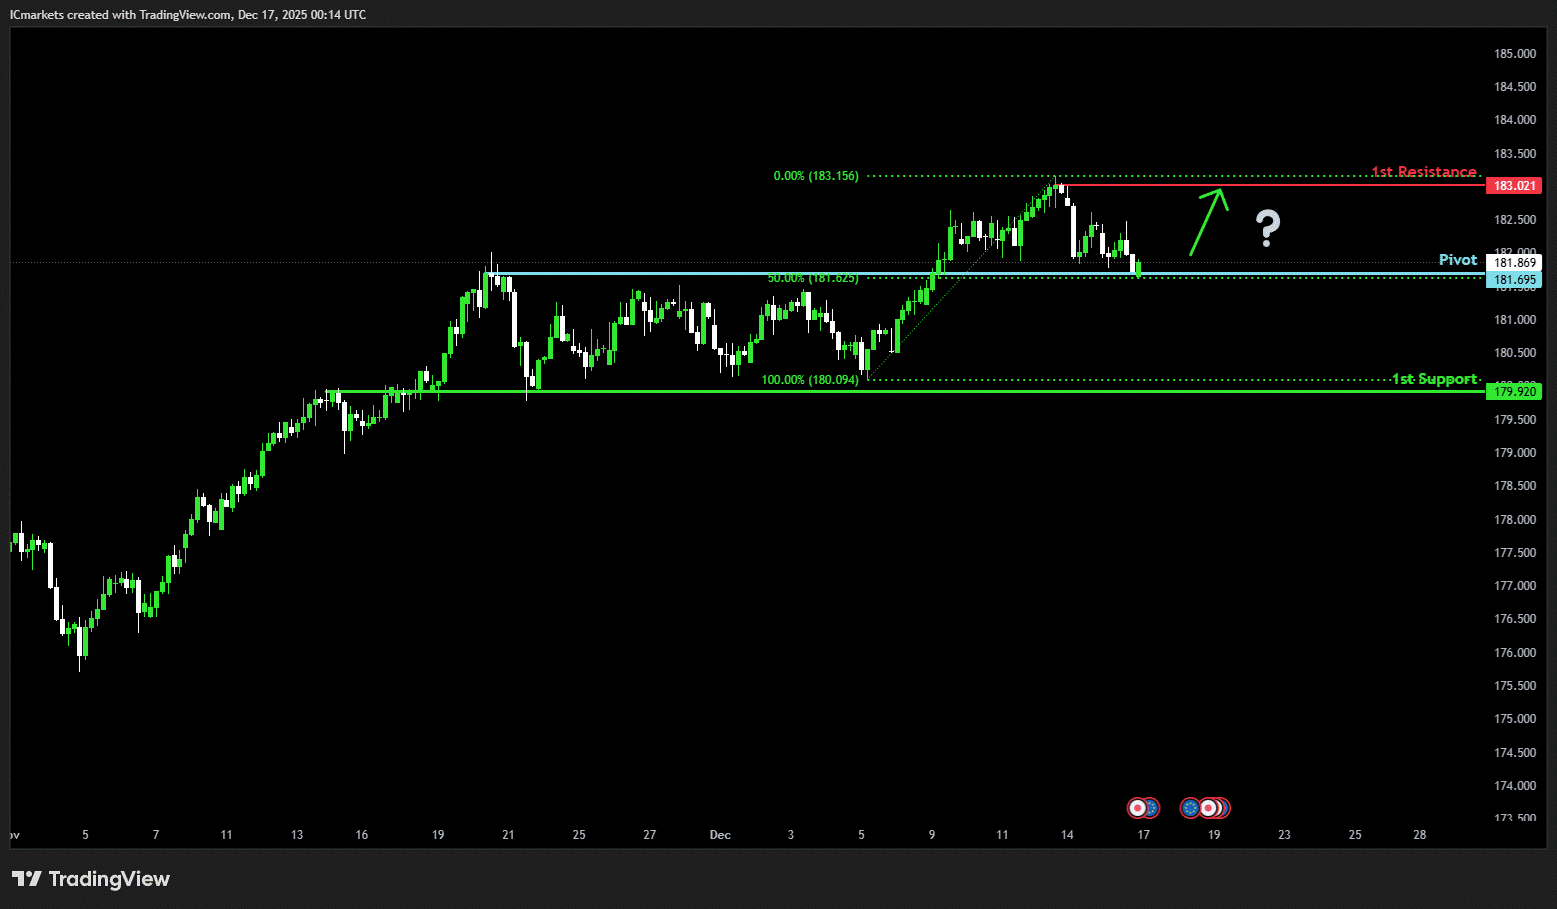
EUR/JPY:
Potential Direction: Bullish
Overall momentum of the chart: Bullish
The price could see a short-term pullback toward the pivot before rising again toward the 1st resistance.
Pivot: 181.69
Supporting reasons: Identified as a pullback support that aligns with the 50% Fibonacci retracement, where renewed buying pressure could emerge to push the price higher.
1st support: 179.92
Supporting reasons: Identified as a pullback support, indicating a potential area where the price could again stabilize.
1st resistance: 183.02
Supporting reasons: Identified as a swing high resistance, indicating a potential level that could cap further upward movement.
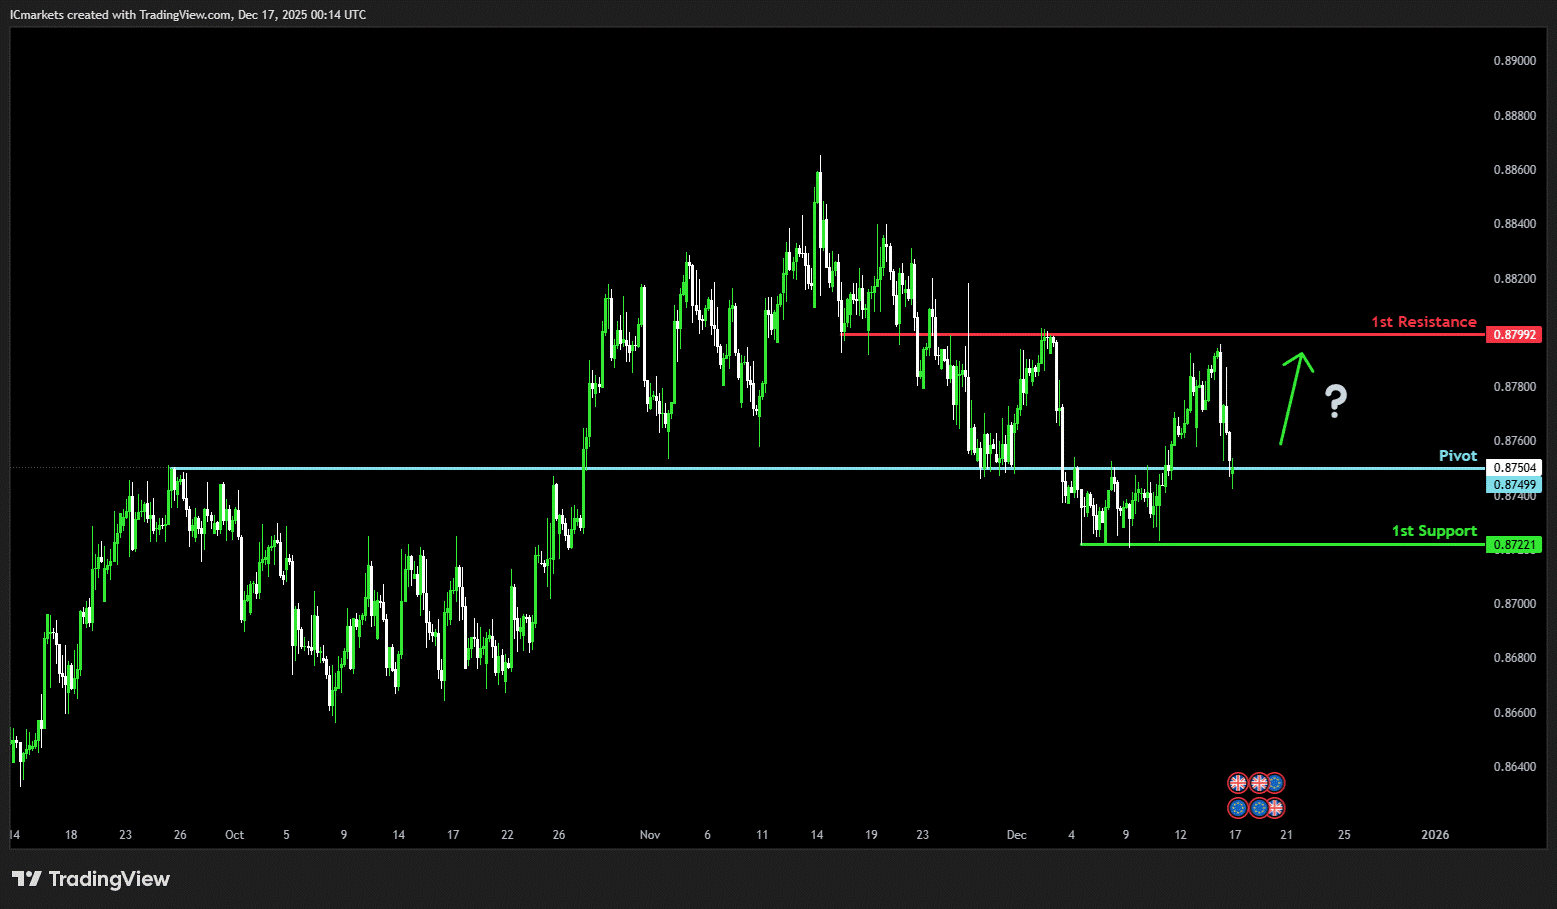
EUR/GBP:
Potential Direction: Bullish
Overall momentum of the chart: Bullish
The price could see a short-term pullback toward the pivot before rising again toward the 1st resistance.
Pivot: 0.8749
Supporting reasons: Identified as a pullback support, where renewed buying pressure could emerge to push the price higher.
1st support: 0.8722
Supporting reasons: Identified as a multi-swing low support, indicating a potential area where the price could stabilize once more.
1st resistance: 0.8799
Supporting reasons: Identified as an overlap resistance, indicating a potential level that could cap further upward movement.
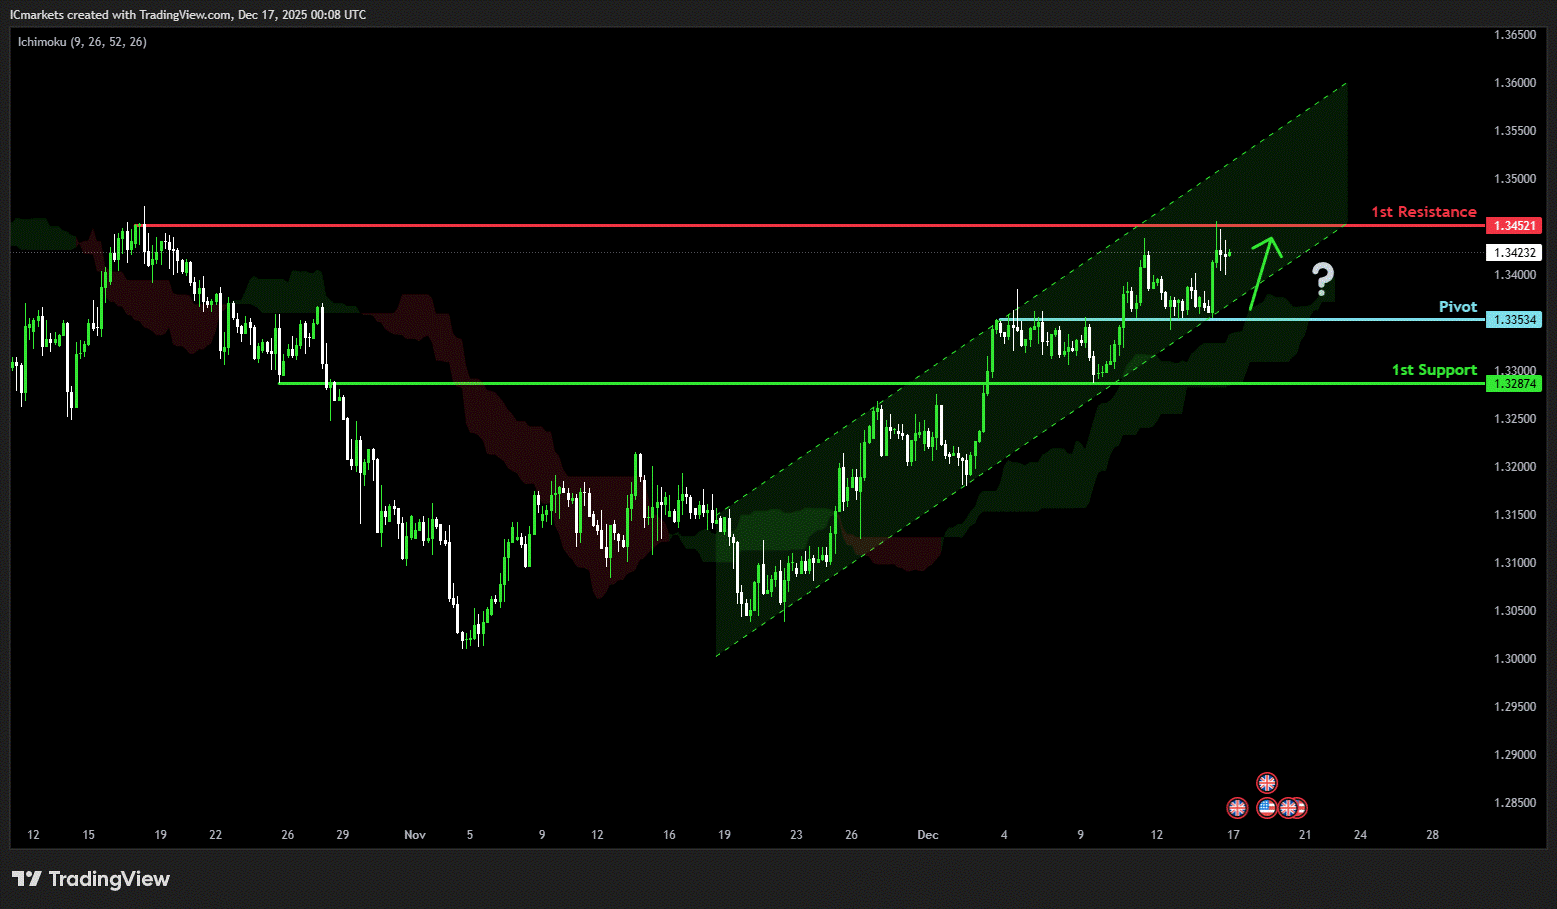
GBP/USD:
Potential Direction: Bullish
Overall momentum of the chart: Bullish
The price could see a short-term pullback toward the pivot before rising again toward the 1st resistance.
Pivot: 1.3353
Supporting reasons: Identified as a pullback support, where renewed buying pressure could emerge to push the price higher.
1st support: 1.3287
Supporting reasons: Identified as an overlap support, indicating a potential area where the price could stabilize once more.
1st resistance: 1.3452
Supporting reasons: Identified as a swing high resistance, indicating a potential level that could halt further upward movement.
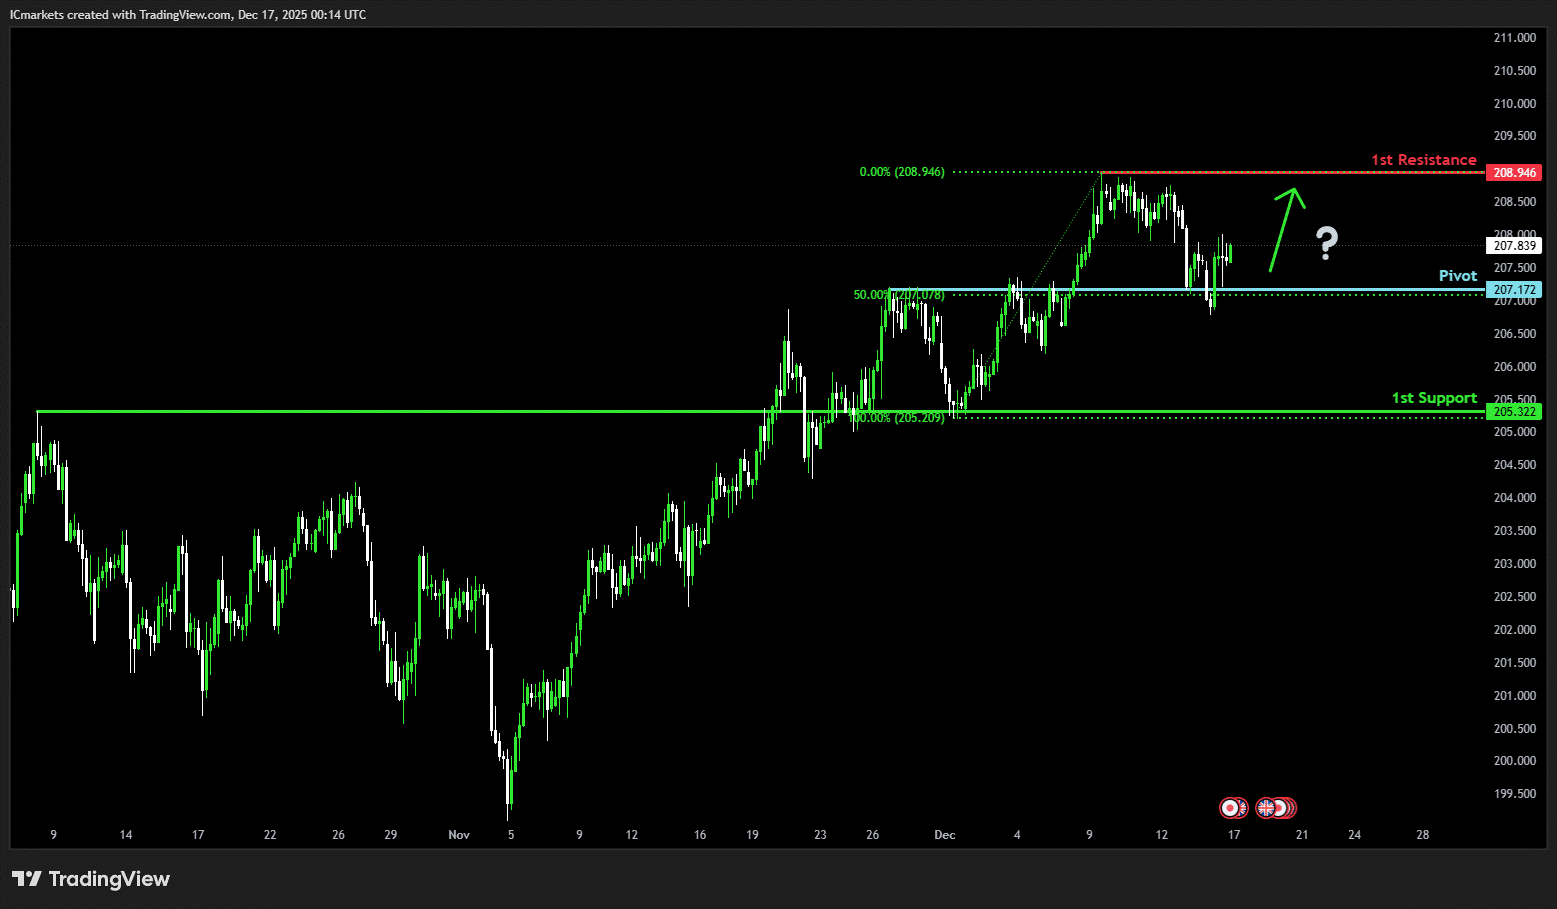
GBP/JPY:
Potential Direction: Bullish
Overall momentum of the chart: Bullish
The price has already bounced off the pivot and may continue its bullish move toward the 1st resistance
Pivot: 207.17
Supporting reasons: Identified as an overlap resistance that aligns with the 50% Fibonacci retracement, where selling pressures could intensify and potentially cap any upward retracement
1st support: 205.32
Supporting reasons: Identified as an overlap support, indicating a potential level where the price could stabilize once more.
1st resistance: 208.94
Supporting reasons: Identified as a swing high resistance, indicating a potential level that could halt further upward movement.
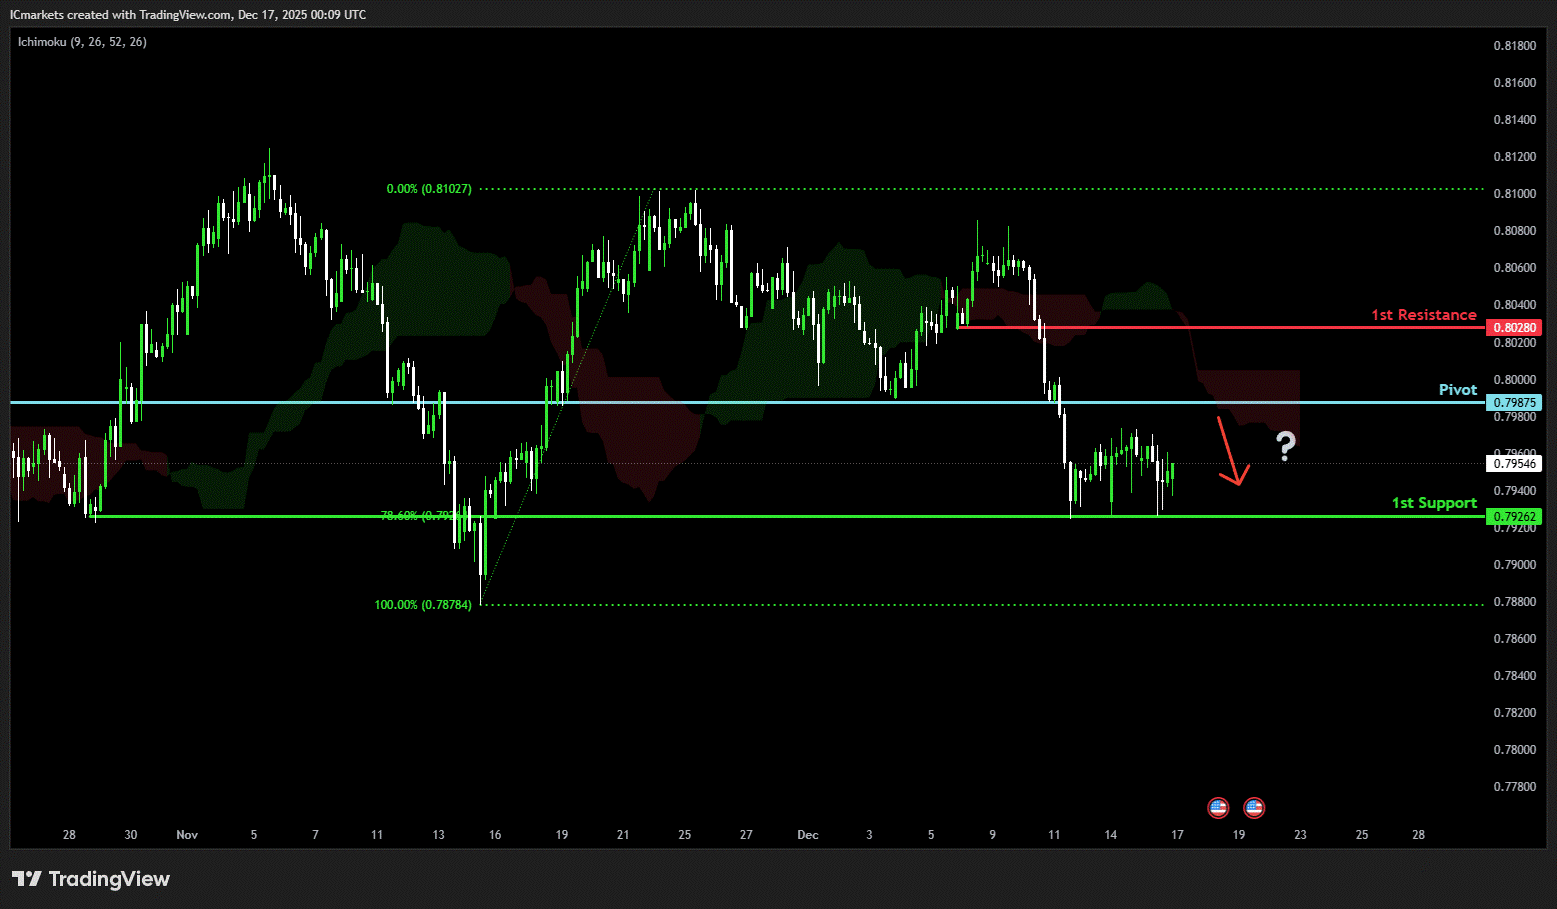
USD/CHF:
Potential Direction: Bearish
Overall momentum of the chart: Bearish
The price could see a short-term pullback toward the pivot before continuing its bearish move down toward the 1st support.
Pivot: 0.7987
Supporting reasons: Identified as a pullback resistance, where selling pressures could intensify and potentially cap any upward retracement.
1st support: 0.7926
Supporting reasons: Identified as a pullback support that aligns with the 78.6% Fibonacci retracement, indicating a potential level where the price could stabilize once again.
1st resistance: 0.8028
Supporting reasons: Identified as a pullback resistance, indicating a potential level that could cap further upward movement.
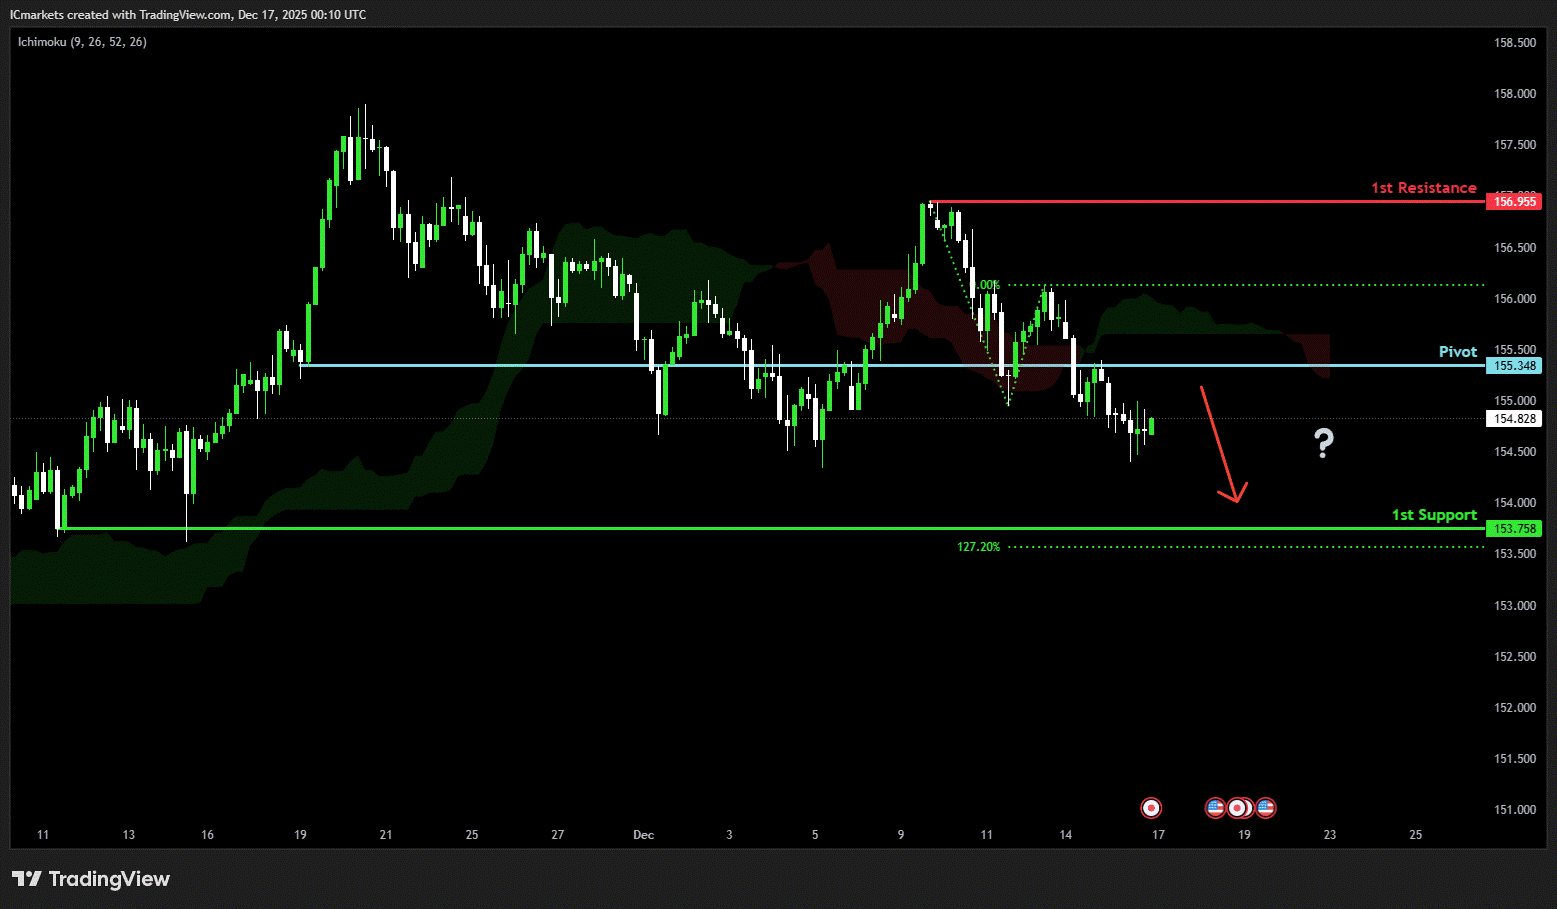
USD/JPY:
Potential Direction: Bearish
Overall momentum of the chart: Bullish
The price has already reacted off the pivot and may continue its bearish move toward the 1st support.
Pivot: 155.34
Supporting reasons: Identified as an overlap resistance, where selling pressures could intensify and potentially cap any upward retracement
1st support: 153.75
Supporting reasons: Identified as a swing low support that aligns closely with the 127.2% Fibonacci projection, indicating a strong area where buyers might return, and the price could stabilize once again.
1st resistance: 156.95
Supporting reasons: Identified as a swing high resistance. This level represents the next key area where upward movement could be capped amid increased selling pressure
USD/CAD:
Potential Direction: Bearish
Overall momentum of the chart: Bearish
The price could see a short-term pullback toward the pivot before continuing its bearish move down toward the 1st support.
Pivot: 1.3810
Supporting reasons: Identified as a pullback resistance, where selling pressures could intensify and potentially cap any upward retracement.
1st support: 1.3728
Supporting reasons: Identified as a swing low support, indicating a key level where the price could stabilize once more.
1st resistance: 1.3889
Supporting reasons: Identified as a pullback resistance, making it a possible target for bullish advances and a level where some sellers could return to cap gains
AUD/USD:
Potential Direction: Bullish
Overall momentum of the chart: Bullish
The price could see a short-term pullback toward the pivot before rising again toward the 1st resistance.
Pivot: 0.6622
Supporting reasons: Identified as an overlap support that aligns with the 23.6% Fibonacci retracement, where renewed buying pressure could emerge to push the price higher.
1st support: 0.6572
Supporting reasons: Identified as a pullback support that aligns with the 38.6% Fibonacci retracement, this area has provided strong support historically and may attract buying interest for a potential short-term bounce
1st resistance: 0.6684
Supporting reasons: Identified as an overlap resistance that aligns with the 161.8% Fibonacci extension, indicating a potential area that could halt any further upward movement.
NZD/USD
Potential Direction: Bearish
Overall momentum of the chart: Bullish
The price has already reacted off the pivot and may continue its bearish move toward the 1st support.
Pivot: 0.5796
Supporting reasons: Identified as an overlap resistance, where selling pressures could intensify and potentially cap any upward retracement.
1st support: 0.5743
Supporting reasons: Identified as a pullback support that aligns with the 38.2% Fibonacci retracement, this area has provided strong support historically and may attract buying interest for a potential short-term bounce
1st resistance: 0.5831
Supporting reasons: Identified as a swing high resistance, indicating a potential area that could halt any further upward movement.
US30 (DJIA):
Potential Direction: Bullish
Overall momentum of the chart: Bullish
The price could see a short-term pullback toward the pivot before rising again toward the 1st resistance.
Pivot: 48,000
Supporting reasons: Identified as a pullback support that aligns with the 61.8% Fibonacci retracement, where renewed buying pressure could emerge to push the price higher.
1st support: 47,372.40
Supporting reasons: Identified as a pullback support, suggesting a potential area where the price could stabilize once again.
1st resistance: 48,879.50
Supporting reasons: Identified as a swing high resistance, indicating a potential area that could halt any further upward movement.
DE40 (DAX):
Potential Direction: Bullish
Overall momentum of the chart: Bullish
The price could see a short-term pullback toward the pivot before rising again toward the 1st resistance.
Pivot: 23,945.80
Supporting reasons: Identified as a pullback support, where renewed buying pressure could emerge to push the price higher.
1st support: 23,488.00
Supporting reasons: Identified as a pullback support, indicating a key level where the price could stabilize once more.
1st resistance: 24,444.50
Supporting reasons: Identified as a swing high resistance that aligns with the 100% Fibonacci projection, indicating a potential area that could halt any further upward movement.
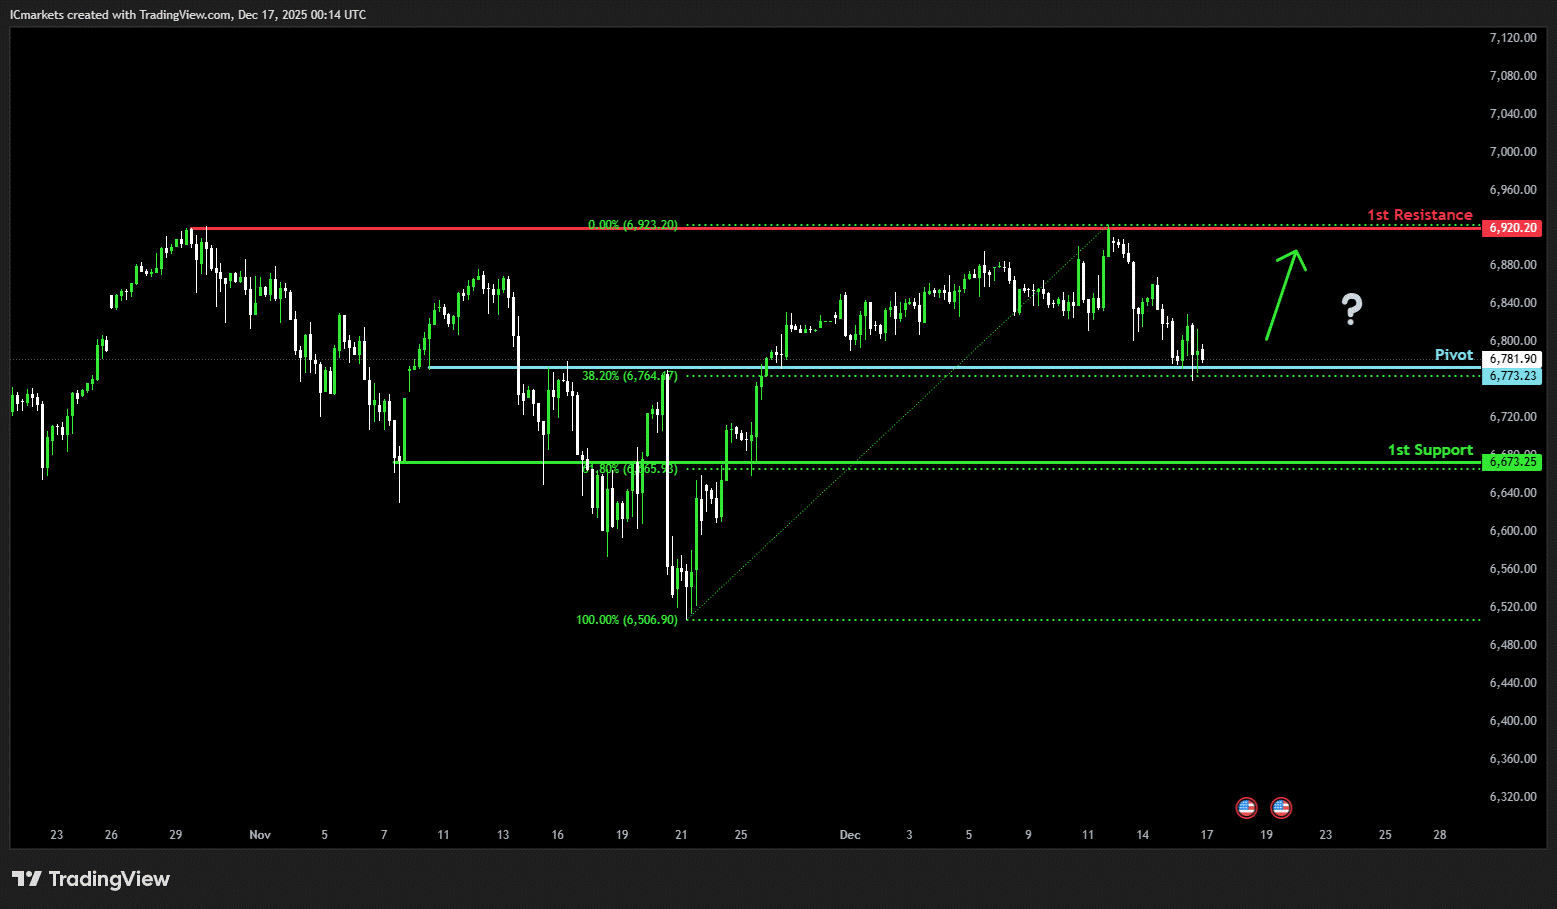
US500 (S&P 500):
Potential Direction: Bullish
Overall momentum of the chart: Bullish
The price could see a short-term pullback toward the pivot before rising again toward the 1st resistance.
Pivot: 6,773.23
Supporting reasons: Identified as a pullback support that aligns with the 38.2% Fibonacci retracement, where renewed buying pressure could emerge to push the price higher.
1st support: 6,673.25
Supporting reasons: Identified as an overlap support that aligns with the 61.8% Fibonacci retracement, indicating a potential level where the price could stabilize once again.
1st resistance: 6,920.20
Supporting reasons: Identified as a swing high resistance, indicating a potential area that could halt any further upward movement.
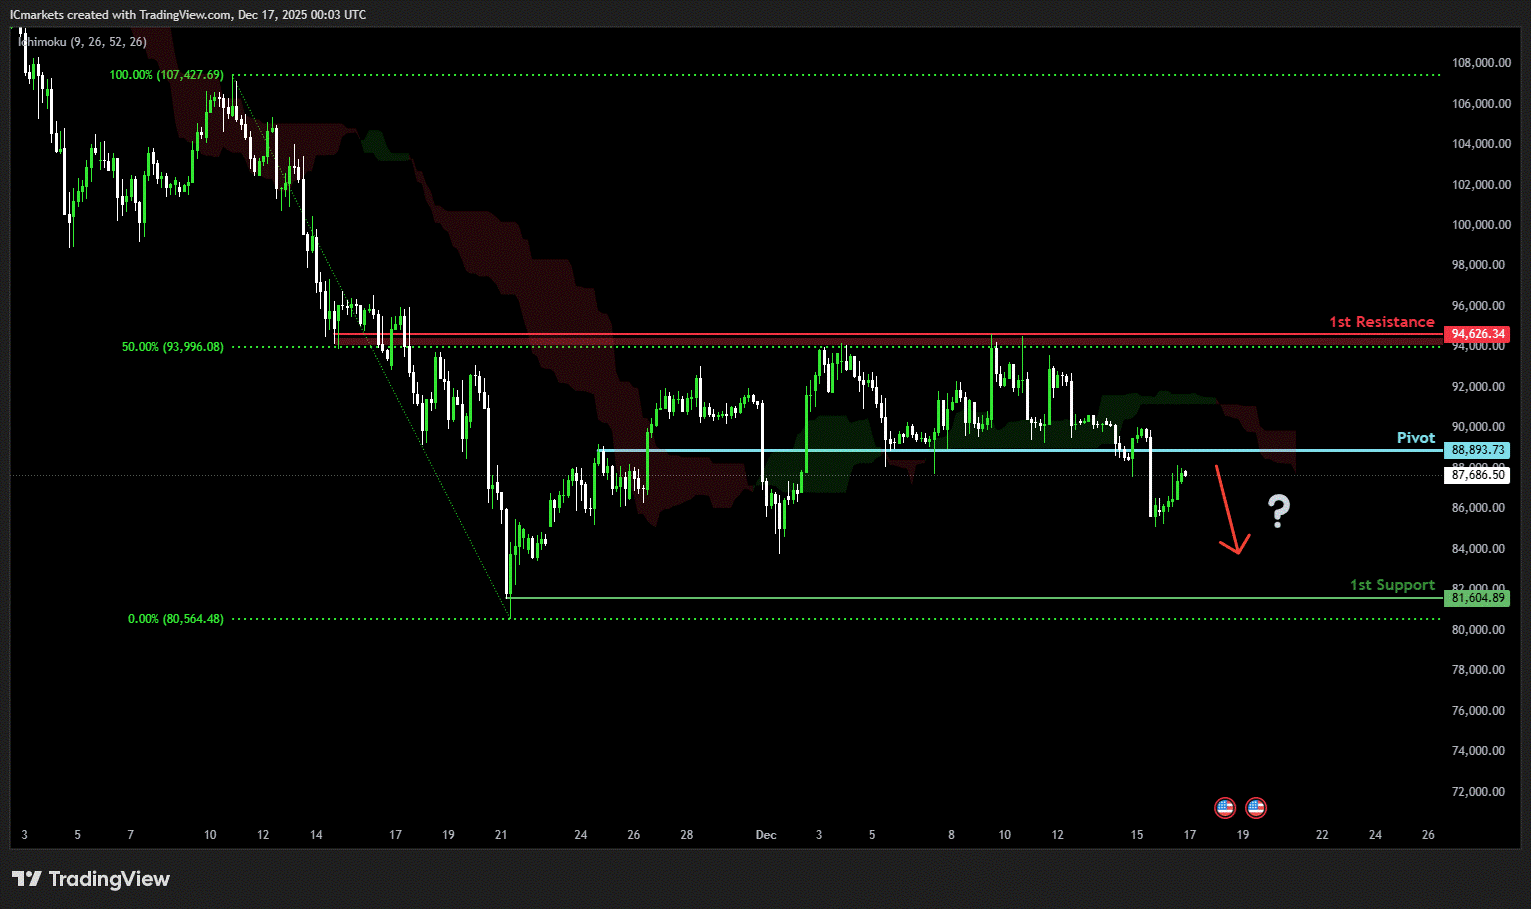
BTC/USD (Bitcoin):
Potential Direction: Bearish
Overall momentum of the chart: Bearish
The price could see a short-term pullback toward the pivot before continuing its bearish move down toward the 1st support.
Pivot: 88,893.73
Supporting reasons: Identified as a pullback resistance, where selling pressures could intensify and potentially cap any upward retracement.
1st support: 81,604.89
Supporting reasons: Identified as a swing low support, indicating a potential level where the price could stabilize once more.
1st resistance: 94,626.23
Supporting reasons: Identified as an overlap resistance that aligns with the 50% Fibonacci retracement, indicating a potential area that could halt any further upward movement.
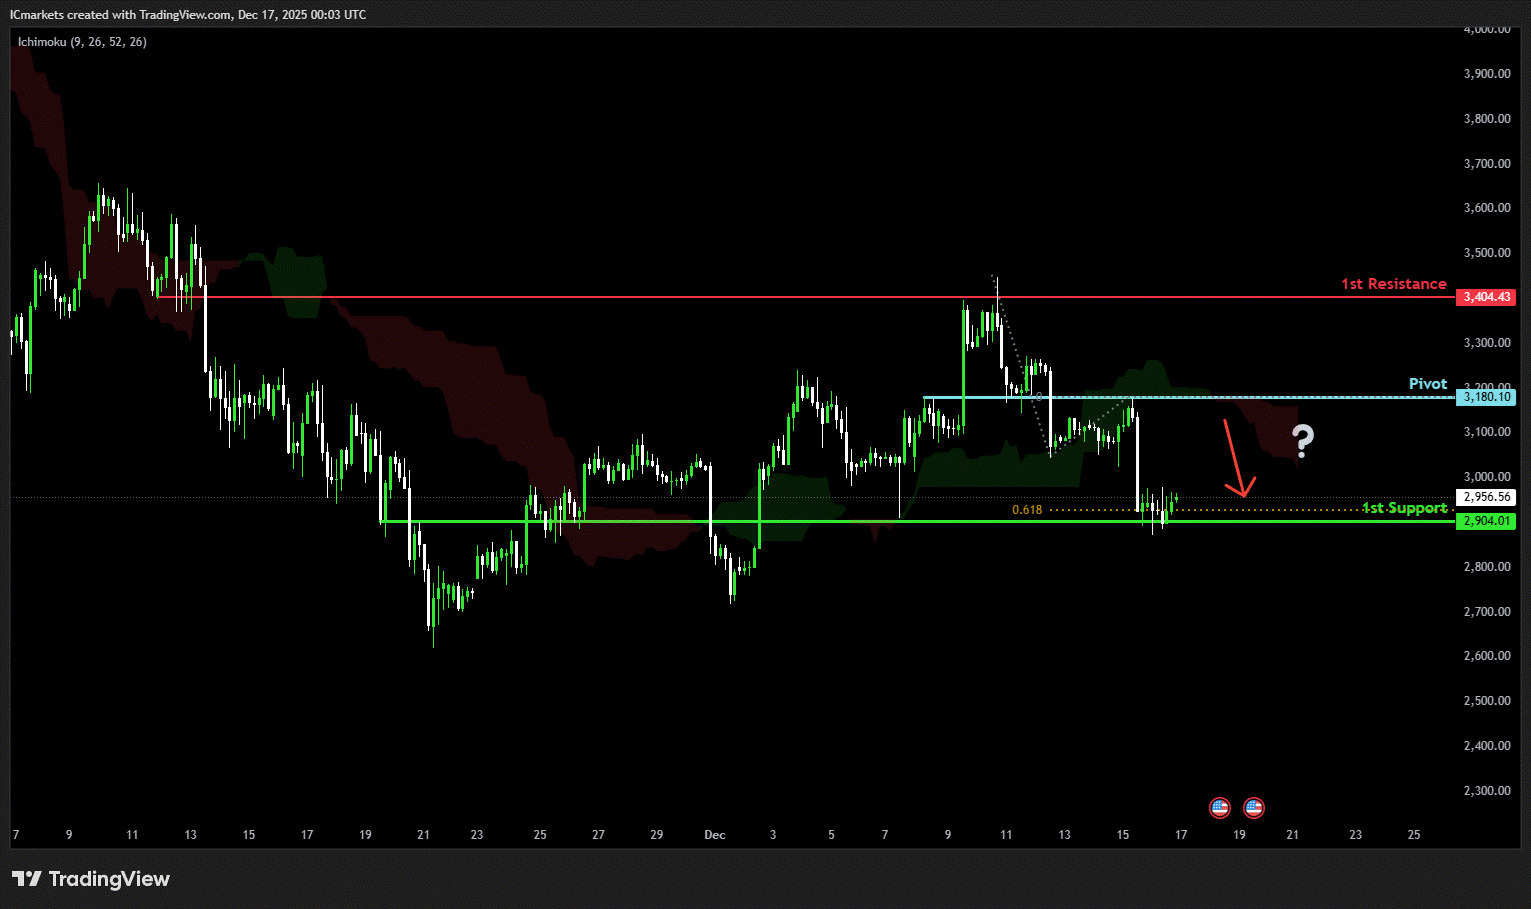
ETH/USD (Ethereum):
Potential Direction: Bearish
Overall momentum of the chart: Bullish
The price could see a short-term pullback toward the pivot before continuing its bearish move down toward the 1st support.
Pivot: 3,180.10
Supporting reasons: Identified as an overlap resistance, where selling pressures could intensify and potentially cap any upward retracement.
1st support: 2,904.01
Supporting reasons: Identified as an overlap support that aligns with the 61.8% Fibonacci projection, indicating a potential level where the price could stabilize once more.
1st resistance: 3,404.43
Supporting reasons: Identified as an overlap resistance, indicating a potential area that could halt any further upward movement.
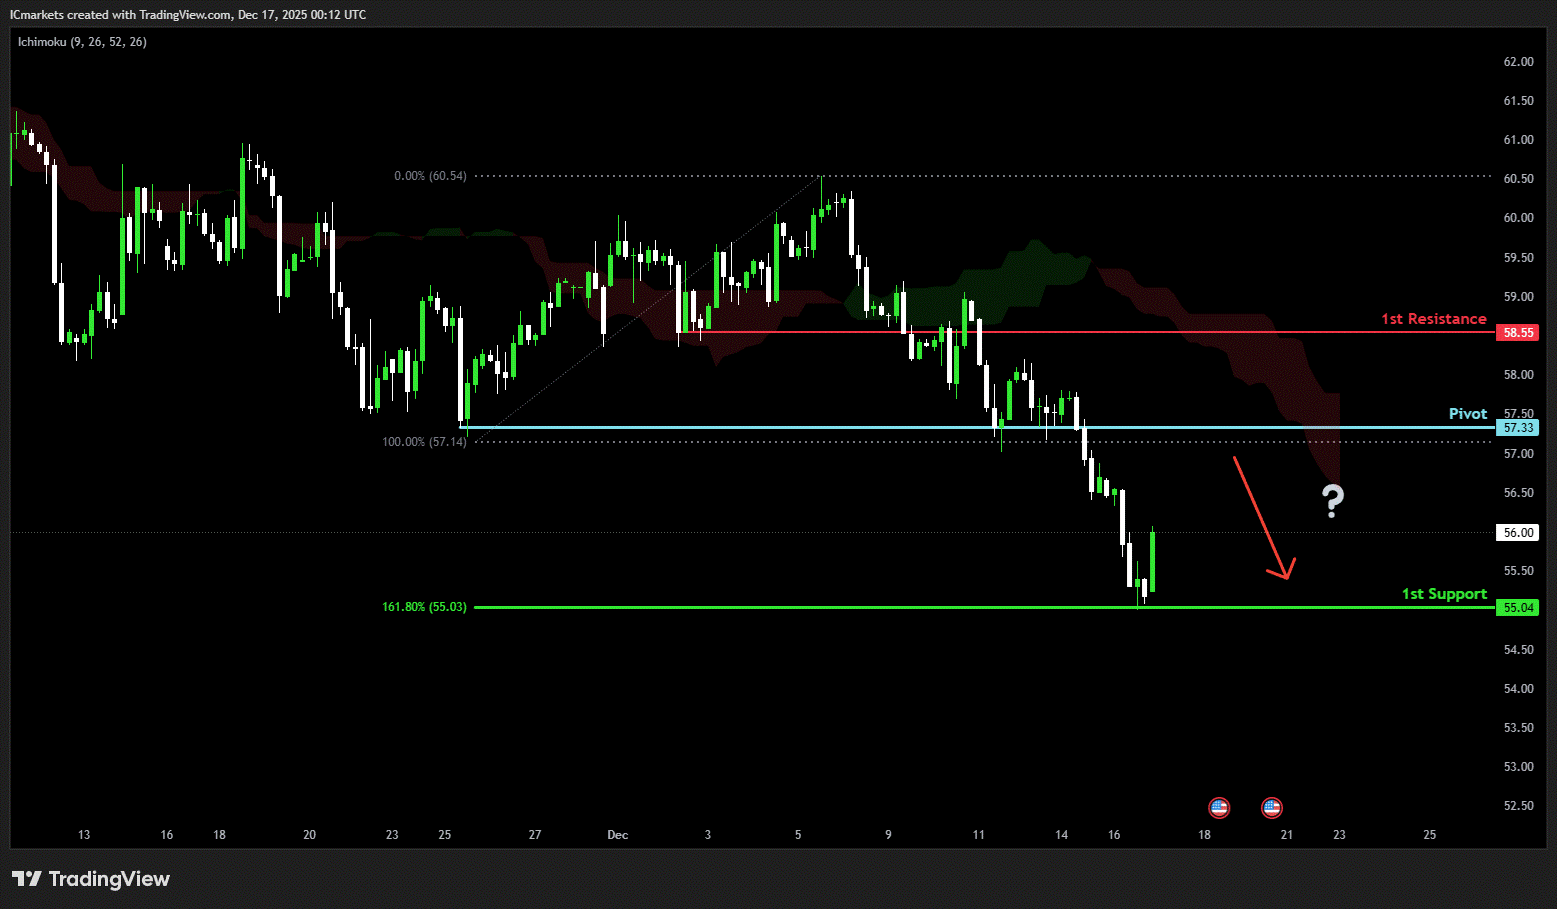
WTI/USD (Oil):
Potential Direction: Bearish
Overall momentum of the chart: Bullish
The price could see a short-term pullback toward the pivot before continuing its bearish move down toward the 1st support.
Pivot: 57.33
Supporting reasons: Identified as a pullback resistance, where selling pressures could intensify and potentially cap any upward retracement.
1st support: 55.04
Supporting reasons: Identified as a swing low support that aligns with the 161.8%% Fibonacci extension and the 100% Fibonacci projection, indicating a key level where the price could stabilize once more.
1st resistance: 58.55
Supporting reasons: Identified as a pullback resistance, indicating a potential area that could halt any further upward movement.
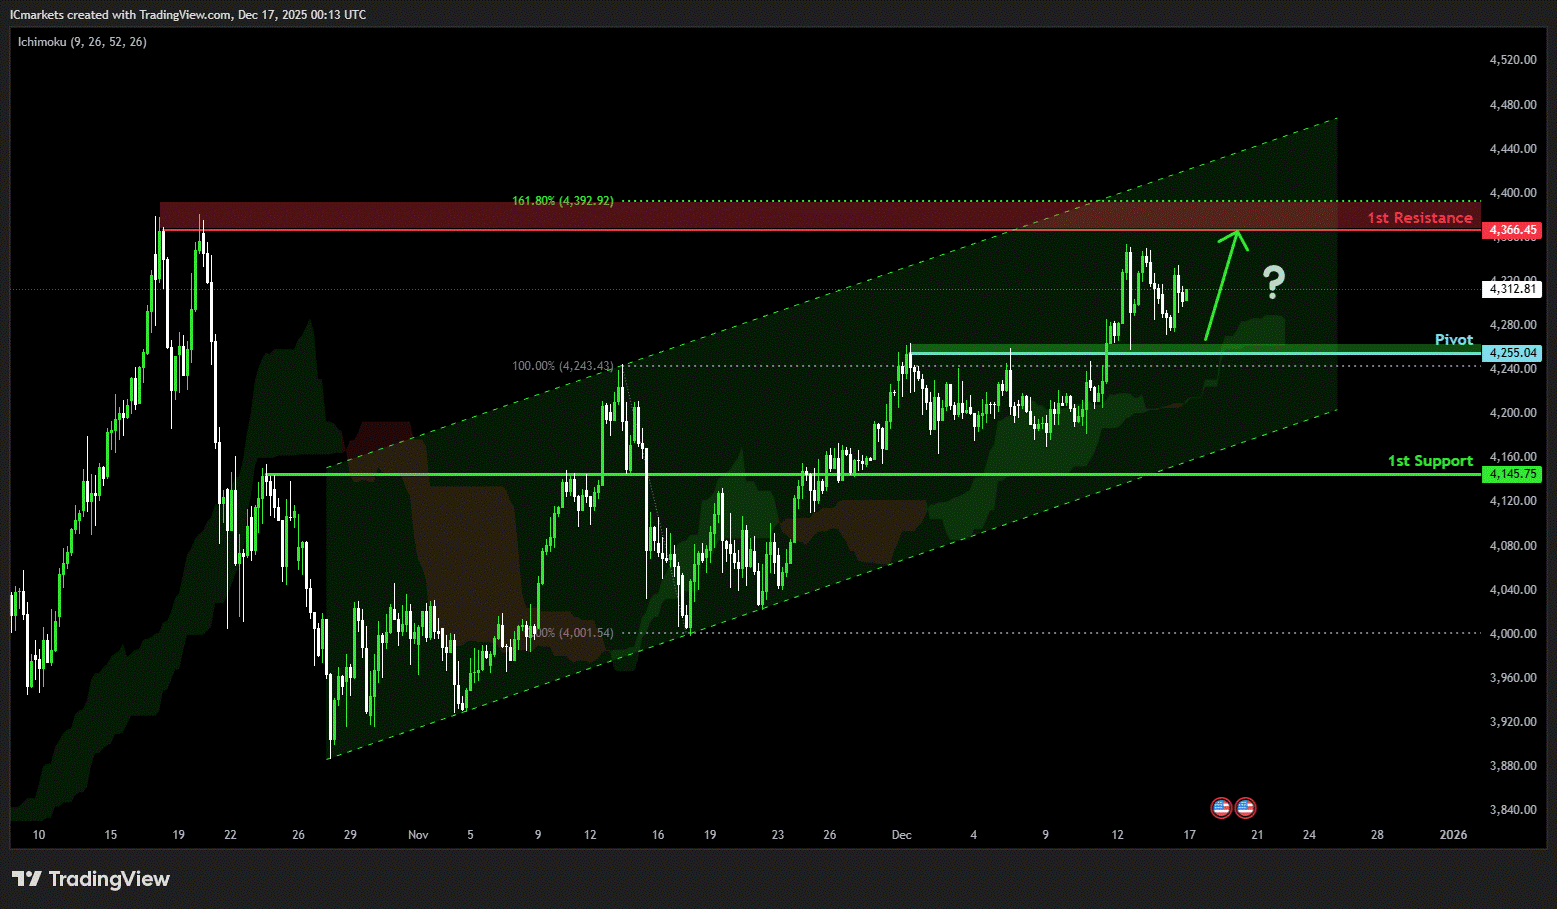
XAU/USD (GOLD):
Potential Direction: Bullish
Overall momentum of the chart: Bullish
The price could see a short-term pullback toward the pivot before rising again toward the 1st resistance.
Pivot: 4,255.04
Supporting reasons: Identified as a pullback support, where renewed buying pressure could emerge to push the price higher.
1st support: 4,145.75
Supporting reasons: Identified as a pullback support, indicating a key level where the price could stabilize once more.
1st resistance: 4,366.45
Supporting reasons: Identified as a swing high resistance that aligns with the 161.8% Fibonacci extension, indicating a potential area that could halt any further upward movement.
The accuracy, completeness and timeliness of the information contained on this site cannot be guaranteed. IC Markets Global does not warranty, guarantee or make any representations, or assume any liability regarding financial results based on the use of the information in the site.
News, views, opinions, recommendations and other information obtained from sources outside of www.icmarkets.com, used in this site are believed to be reliable, but we cannot guarantee their accuracy or completeness. All such information is subject to change at any time without notice. IC Markets Global assumes no responsibility for the content of any linked site.
The fact that such links may exist does not indicate approval or endorsement of any material contained on any linked site. IC Markets Global is not liable for any harm caused by the transmission, through accessing the services or information on this site, of a computer virus, or other computer code or programming device that might be used to access, delete, damage, disable, disrupt or otherwise impede in any manner, the operation of the site or of any user’s software, hardware, data or property.
The post Wednesday 17th December 2025: Technical Outlook and Review first appeared on IC Markets | Official Blog.
IC Markets Global – Asia Fundamental Forecast | 17 December 2025
December 17, 2025 16:39 ICMarkets Market News
IC Markets Global – Asia Fundamental Forecast | 17 December 2025
What happened in the U.S. session?
Overnight U.S. trading was dominated by macro signals that the economy is cooling but not collapsing: the November jobs report showed rising unemployment alongside modest job creation, and flash PMIs pointed to the slowest business‑activity growth in six months. This mix pushed investors into a more defensive stance, softening the dollar, nudging Treasury yields lower, and weighing on major equity indices, while safe‑haven assets like gold and, to a lesser degree, high‑quality bonds saw support.
What does it mean for the Asia Session?
Across the Asian Wednesday session and into Europe, the focus is on a dense UK and Eurozone inflation docket, the German Ifo survey, and Indonesia’s policy decision, all of which will shape moves in GBP, EUR, and regional EM FX. As the trading day rolls into New York, attention shifts to multiple Fed speeches, U.S. mortgage statistics, and DOE inventory releases that can sway U.S. yields, the dollar, and crude benchmarks.
The Dollar Index (DXY)
Key news events today
FOMC Member Waller Speaks (1:15 pm GMT)
What can we expect from DXY today?
Today’s dollar trade on Wednesday is characterized by consolidation near two‑month lows within a broader downtrend driven by softer U.S. data and firm expectations of further Fed rate cuts. The currency continues to underperform against higher‑yielding and risk‑sensitive peers such as the Australian and New Zealand dollars, while traditional safe‑havens like the yen and Swiss franc remain supported following the recent Fed‑induced slide.
Central Bank Notes:
- The Federal Open Market Committee (FOMC) is widely expected to lower the federal funds rate target range by 25 basis points to 3.50%–3.75% at its December 9–10, 2025, meeting, marking the third consecutive cut after the October reduction to 3.75%–4.00%
- The Committee continues to pursue maximum employment and 2% inflation goals, with the labor market showing further softening as the unemployment rate rose to 4.4% in September 2025 amid modest job gains.
- Officials note persistent downside risks to growth alongside resilient activity, with inflation easing to 3.0% year-over-year CPI in September but remaining elevated due to tariff effects; core PCE stands at around 2.8% as of October.
- Economic activity grew at a 3.8% annualized pace in Q2 2025 per revised estimates, though Q3 and Q4 face headwinds from trade tensions, fiscal restraint, and data disruptions like the government shutdown.
- September’s Summary of Economic Projections forecasts 2025 unemployment at a median 4.5%, with PCE inflation near 3.0% and core PCE at 3.1%, signaling a gradual disinflation path; updates expected on December 10 may adjust for higher unemployment and lower growth.
- The Committee maintained its data-dependent approach, noting a softening labor market and inflation above the 2% target, while deciding to lower the federal funds rate target range by 25 basis points to 3.50%-3.75%. Dissent persisted, with multiple members opposing the cut or advocating for a hold, reflecting divisions similar to recent meetings.
- The FOMC confirmed the conclusion of its quantitative tightening program effective December 1, 2025, with Treasury rolloff caps at $5 billion per month and agency MBS caps at $35 billion per month to ensure ample reserves and market stability.
- The next meeting is scheduled for 27 to 28 January 2026.
Next 24 Hours Bias
Medium Bearish
Gold (XAU)
Key news events today
FOMC Member Waller Speaks (1:15 pm GMT)
What can we expect from Gold today?
Gold is consolidating just above the 4,300 USD/oz area today, holding near recent record territory after this year’s powerful precious‑metals rally. Price action is relatively contained as traders balance ongoing support from low real yields and geopolitical risks against profit‑taking near all‑time highs and event risk around upcoming Federal Reserve decisions.
Next 24 Hours Bias
Strong Bullish
The Australian Dollar (AUD)
Key news events today
No major news event
What can we expect from AUD today?
The Australian Dollar is trading slightly weaker but not collapsing, as mixed domestic data, soft Chinese momentum, and a tentative global risk tone offset support from relatively high Australian rates and a hawkish RBA. AUD/USD remains confined to a tight range near 0.66–0.67, with markets looking to forthcoming Australian figures and major U.S. data to determine whether the next leg is a break lower toward 0.6550 or a recovery back toward recent highs.
Central Bank Notes:
- The Reserve Bank of Australia held its cash rate steady at 3.60% at the November 2025 policy meeting, adopting a cautious tone amid a surprise uptick in inflation data for the September quarter. This marks the fourth consecutive pause since the 25 basis point cut in August. The Board attributed some of the inflation rise to temporary factors like higher petrol prices and council rates, but noted signs of more persistent pressures from consumer demand.
- Policymakers emphasized vigilance on inflation, with trimmed mean inflation expected to remain elevated in the near term before nearing the 2–3% target midpoint by mid-2027. Recent data showed underlying inflation staying above target until at least the second half of 2026, prompting upward revisions to forecasts. Capacity pressures are seen as slightly more pronounced than previously assessed, delaying any easing.
- Headline CPI for the September quarter exceeded expectations, driven partly by temporary items, while underlying measures signal ongoing stickiness. The shift to monthly CPI reporting, with the first full edition in November 2025, will enhance real-time inflation monitoring. Housing and services remain resilient contributors to price pressures.
- Domestic demand shows firmness in services alongside below-trend growth elsewhere, with capacity pressures not expected to ease significantly. The labor market is gradually softening, with unemployment projected to stabilize around 4.4%, though wage growth and productivity dynamics keep unit labor costs a concern. Household spending faces headwinds from high borrowing costs.
- Global risks include geopolitical tensions and commodity volatility, set against modestly revised-up world growth outlooks. The Board describes its policy as mildly restrictive and data-dependent, balancing inflation control with employment goals. No rate hike was considered despite the inflation surprise.
- Monetary policy remains mildly restrictive to address lingering price stability risks amid household and global vulnerabilities. Communications reaffirm the dual mandate of 2–3% inflation and full employment, with readiness to adjust based on incoming data.
- Market expectations point to the cash rate holding through early 2026, with a possible modest cut to 3.3% mid-year if inflation eases as forecast. The new monthly CPI data will be key for timely insights.
- Monetary policy remains mildly restrictive, balancing progress on price stability against vulnerabilities in household demand and global outlook. Board communications reaffirm a dual mandate: price stability and full employment, while underscoring readiness to respond should risks materialize sharply.
- Analysts generally expect the cash rate to remain at current levels through early 2026, with only modest cuts possible later in the year if inflation moderates. The new monthly CPI release (first full edition Nov 2025) will be watched closely for timely signals on price trends.
- The next meeting is on 2 to 3 February 2026.
Next 24 Hours Bias
Medium Bullish
The Kiwi Dollar (NZD)
Key news events today
GDP q/q (9:45 pm GMT)
What can we expect from NZD today?
For Wednesday, the New Zealand Dollar is edging higher but trading inside recent ranges as markets balance a softer U.S. dollar against New Zealand’s weak fiscal and growth outlook. The marquee event for the kiwi is the late‑session Q3 GDP release, which could either validate hopes of a tentative recovery or reinforce recession fears and renewed RBNZ easing. With major houses still forecasting substantial rate cuts and medium‑term NZD underperformance, price action today is likely to be highly data‑dependent, especially in NZD/USD and NZD crosses versus AUD and JPY.
Central Bank Notes:
- The Monetary Policy Committee (MPC) left the Official Cash Rate (OCR) unchanged at 2.25% at its 26 November 2025 meeting, following the widely anticipated 25-basis-point reduction from 2.50%, and signaled that policy is now firmly in stimulatory territory while keeping the option of further easing on the table if needed.
- The decision was again reached by consensus, with members judging that the cumulative 325 basis points of easing over the past year warranted a period of assessment, even as several emphasized a willingness to cut further should incoming data point to a more protracted downturn or renewed disinflationary pressures.
- Headline consumer price inflation is projected to hover near 3% in late 2025 before gradually easing toward the 2% midpoint of the 1–3% target band through 2026, supported by contained inflation expectations around 2.3% over the two-year horizon and an expected pickup in spare capacity.
- The MPC noted that domestic demand remains subdued but shows tentative signs of stabilisation, with softer household spending and construction only partially offset by improving services activity; nevertheless, policymakers still expect services inflation to ease as wage growth moderates and the labour market loosens further over the coming year.
- Financial conditions continue to ease as wholesale and retail borrowing rates reprice to the lower OCR, contributing to gradually rising mortgage approvals and improving housing-related sentiment, although broader business credit growth remains patchy and sensitive to uncertainty about the durability of the recovery.
- Recent data confirm that GDP momentum is weak but not deteriorating as sharply as earlier in 2025, with high-frequency indicators pointing to a shallow recovery from a low base and ongoing headwinds from elevated living costs and fragile confidence weighing on discretionary consumption and investment.
- The MPC reiterated that external risks remain skewed to the downside, particularly from softer Chinese demand and uncertainty around United States trade policy, but noted that a lower New Zealand dollar continues to provide some offset via improved export competitiveness and support for tradables inflation.
- Looking ahead to early 2026, the Committee maintained a mild easing bias, indicating that a further cut toward 2.00–2.10% cannot be ruled out if activity fails to gain traction or if inflation undershoots projections, but current forecasts envisage the OCR remaining near 2.25% for an extended period provided inflation converges toward target and the recovery proceeds broadly as expected.
- The next meeting is on 18 February 2026.
Next 24 Hours Bias
Medium Bullish
The Japanese Yen (JPY)
Key news events today
No major news event
What can we expect from JPY today?
Today, the Japanese Yen is firmer as markets anticipate a meaningful BOJ rate hike to about 0.75%, its highest level in roughly 30 years, supported by the strongest business‑confidence readings since 2021 and official rhetoric that tolerates further tightening. USD/JPY has slipped into the mid‑154s while front‑end volatility rises, with investors eyeing the risk of a sharper yen rally if the BOJ signals a steeper hiking path or concrete plans to shrink its ETF and JGB holdings.
Central Bank Notes:
- The Policy Board of the Bank of Japan will meet on 18–19 December with markets almost fully pricing a 25-basis-point hike, which would raise the short-term policy rate from 0.50% to around 0.75%, as the bank moves further away from its ultra-loose stance while stressing that any tightening will remain gradual and data-dependent.
- The BOJ is expected to continue guiding the uncollateralized overnight call rate in a narrow band around the new policy rate, near 0.75%, while signaling that the pace and timing of any additional hikes will depend on how past increases affect bank lending, corporate financing conditions, and overall economic activity.
- The quarterly path of JGB purchases remains on a pre-announced, gradual taper: outright purchases are being reduced by about ¥400 billion per quarter through March 2026, then by roughly ¥200 billion per quarter from April to June 2026, with the bank still aiming for JGB purchases to settle near ¥2 trillion in Q1 2027 and retaining flexibility to adjust the pace if market functioning or yield volatility deteriorate.
- Japan’s economy has softened in the near term, with Q3 2025 GDP contracting at an annualized pace of about 2.3% as weaker residential investment and external demand weighed on activity, even as business sentiment in manufacturing has recently improved to a roughly four-year high.
- Core consumer inflation (excluding fresh food) accelerated to around 3.0% year-on-year in October, up from 2.9% in September and remaining above the BOJ’s 2% target, while the “core-core” measure excluding both fresh food and energy rose to about 3.1%, underscoring persistent underlying price pressures.
- In the very near term, some input-cost pressures are easing as earlier import price surges fade, but services inflation linked to labor shortages, along with steady wage gains, continues to support broader price momentum; firms’ and households’ medium-term inflation expectations remain anchored slightly above 2%, keeping short-term inflation risks tilted to the upside.
- For the coming quarters, the BOJ assesses that real growth will likely run below potential as the economy digests tighter financial conditions and past yen depreciation, though accommodative real rates, positive real wage growth, and improving corporate sentiment should help sustain a modest recovery in private consumption and business investment.
- Over the medium term, as overseas demand stabilizes and domestic labor markets remain tight, the BOJ expects wage settlements and inflation expectations to keep core inflation on a gradual upward trajectory around or slightly above 2%, providing room for further cautious rate normalization as long as financial conditions remain supportive and the recovery is not derailed.
- The next meeting is scheduled for 22 to 23 January 2026.
Next 24 Hours Bias
Medium Bearish
Oil
Key news events today
EIA Crude Oil Inventories (2:30 pm GMT)
What can we expect from Oil today?
Oil markets today are trading with a distinctly bearish bias, with WTI around the mid‑50s and Brent near 60 USD as traders price in persistent oversupply and the possibility that a Russia‑Ukraine peace framework could eventually unlock more Russian exports. Softer Chinese demand indicators, steady but not accelerating global demand forecasts, and continued production growth from OPEC+ and non‑OPEC producers are keeping the futures curve in mild contango and encouraging inventory builds.
Next 24 Hours Bias
Medium Bearish
The post IC Markets Global – Asia Fundamental Forecast | 17 December 2025 first appeared on IC Markets | Official Blog.
Germany December Ifo business climate index 87.6 vs 88.2 expected
December 17, 2025 16:14 Forexlive Latest News Market News
- Prior 88.1; revised to 88.0
- Current conditions index 85.6 vs 85.8 expected
- Prior 85.6
- Expectations index 89.7 vs 90.5 expected
- Prior 90.6; revised to 90.5
The headline reading is softer than estimated with the current conditions and expectations index also missing on estimates. The decline in German business sentiment towards the end of the year puts a dent on the recent optimism surrounding economic expectations, with the headline estimate being the softest since May.
That being said, there is still hopeful optimism looking to next year amid more expansive fiscal policies. So, there is that.
In any case, all of this will not do much to change the ECB outlook for the time being. The central bank is still well expected to keep key interest rates unchanged this week and will continue to do so for the foreseeable future in the early stages of 2026.
As things stand, market players are not expecting much of anything from the central bank. That especially since the euro area economy remains relatively fragile and vulnerable, while sticky inflation in Germany especially continues to prove difficult to tackle and allow for flexibility in terms of easing monetary policy further.
EUR/USD is trading around 1.1717 currently, down around 0.3% on the day. The low earlier touched 1.1704 with the dollar keeping firmer across the board in European morning trade thus far. But in the case of EUR/USD, we do have large option expiries at 1.1700 and 1.1750 keeping things in check and placing a bit of a bookend to price action before we get to US trading later.
This article was written by Justin Low at investinglive.com.
IC Markets Global – Europe Fundamental Forecast | 17 December 2025
December 17, 2025 16:14 ICMarkets Market News
IC Markets Global – Europe Fundamental Forecast | 17 December 2025
What happened in the Asia session?
Japan’s November trade data dominated the Asia session, with exports surging 6.1% year-on-year, exceeding forecasts of 4.8% driven by strong U.S. (up 8.8%) and EU demand in autos, semiconductors, and medical goods, while imports rose a milder 1.3%. This shift led to a ¥322.3 billion surplus in the trade balance, reversing October’s deficit, and fueled speculation about the Bank of Japan’s (BoJ) rate hike amid wage growth signals from Governor Ueda.
What does it mean for the Europe & US sessions?
As European and US sessions open, traders face heightened geopolitical risks from US threats of countermeasures against EU tech/service firms post-fines on US giants like X and Meta, alongside Trump’s Venezuelan oil tanker blockade and defence payout curbs, per recent reports. Macro data remains thin, with US MBA mortgage metrics at noon ET potentially signalling housing trends amid rate stability forecasts, while Eurozone PMIs yesterday confirmed a slowing but positive 51.9 composite output for December’s best quarter since 2022. Volatility may stem from FII outflows and global caution, with no major central bank moves expected soon.
The Dollar Index (DXY)
Key news events today
FOMC Member Waller Speaks (1:15 pm GMT)
What can we expect from DXY today?
The US dollar remained defensive and range-bound near DXY 98.30, weighed down by soft US jobs data and Fed rate cut bets, though it edged up slightly against some Asian currencies like the Taiwan dollar while facing gains from the ringgit; broader weakness persisted over the past month at 1.26% lower.
Central Bank Notes:
- The Federal Open Market Committee (FOMC) is widely expected to lower the federal funds rate target range by 25 basis points to 3.50%–3.75% at its December 9–10, 2025, meeting, marking the third consecutive cut after the October reduction to 3.75%–4.00%
- The Committee continues to pursue maximum employment and 2% inflation goals, with the labour market showing further softening as the unemployment rate rose to 4.4% in September 2025 amid modest job gains.
- Officials note persistent downside risks to growth alongside resilient activity, with inflation easing to 3.0% year-over-year CPI in September but remaining elevated due to tariff effects; core PCE stands at around 2.8% as of October.
- Economic activity grew at a 3.8% annualised pace in Q2 2025 per revised estimates, though Q3 and Q4 face headwinds from trade tensions, fiscal restraint, and data disruptions like the government shutdown.
- September’s Summary of Economic Projections forecasts 2025 unemployment at a median 4.5%, with PCE inflation near 3.0% and core PCE at 3.1%, signalling a gradual disinflation path; updates expected on December 10 may adjust for higher unemployment and lower growth.
- The Committee maintained its data-dependent approach, noting a softening labour market and inflation above the 2% target, while deciding to lower the federal funds rate target range by 25 basis points to 3.50%-3.75%. Dissent persisted, with multiple members opposing the cut or advocating for a hold, reflecting divisions similar to recent meetings.
- The FOMC confirmed the conclusion of its quantitative tightening program effective December 1, 2025, with Treasury rolloff caps at $5 billion per month and agency MBS caps at $35 billion per month to ensure ample reserves and market stability.
- The next meeting is scheduled for 27 to 28 January 2026.
Next 24 Hours Bias
Medium Bearish
Gold (XAU)
Key news events today
FOMC Member Waller Speaks (1:15 pm GMT)
What can we expect from Gold today?
Gold pulled back slightly after a divided Fed rate cut last week, retreating from near-week highs around $4,249, while silver hit record peaks before profit-taking. Over the past sessions, prices swung volatilely, up 0.24% today to about $4,312/oz, with forecasts eyeing a corrective dip but moderate rises to $4,310-$4,339 by month-end due to geopolitical tensions and inflation pressures.
Next 24 Hours Bias
Medium Bullish
The Euro (EUR)
Key news events today
German ifo Business Climate (9:00 am GMT)
What can we expect from EUR today?
The euro traded steadily around 1.1750 against the USD with minimal daily movement, buoyed by ECB hawkishness and year-to-date gains but tempered by US policy risks and EU debates on Russian asset use for Ukraine, where public support varies notably in Italy; carbon markets surged to highs amid mixed energy signals, signalling cautious optimism for the currency.
Central Bank Notes:
- The Governing Council of the ECB is widely expected to keep the three key interest rates unchanged at its 17–18 December 2025 meeting, maintaining the main refinancing rate at 2.15%, the marginal lending facility at 2.40% and the deposit facility at 2.00%. This would reflect policymakers’ assessment that the current policy stance remains broadly consistent with medium‑term price stability, while inflation hovers close to the 2% target and the economy expands at a modest pace. Market pricing and recent ECB commentary suggest a high “option value” in staying on hold, with no clear pre‑set path for the next move amid two‑sided risks around growth and inflation.
- Recent indicators point to broadly stable price dynamics around the ECB’s target. Headline HICP inflation is projected to hover near 2% through late 2025, with earlier energy‑related disinflation largely behind and food price pressures contained compared with previous years. Services and wage inflation remain somewhat firmer than anticipated, but the trend is one of gradual moderation, consistent with a scenario in which inflation stabilises around but not persistently above 2% over the medium term.
- Eurosystem staff projections to be released in December are expected to show only small revisions from the September exercise, maintaining a profile of headline inflation close to 2% in 2025, dipping slightly below in 2026, and returning near target in 2027. Soft producer prices, fading pipeline cost pressures, and anchored long‑term inflation expectations limit upside risks, though officials continue to flag uncertainty from geopolitical tensions, commodity price shocks,s and fiscal policy choices.
- Euro area GDP growth remains subdued but resilient, with most forecasters and survey‑based indicators pointing to an expansion around 1 — 1.25% in 2025 and 2026, followed by a similar pace into 2027. PMIs and confidence surveys suggest activity has stabilised after earlier weakness, with modest support from public investment and improving external demand offsetting soft private consumption and investment.
- The labour market remains tight in aggregate, with unemployment rates close to multi‑decade lows and participation relatively high, even as job creation has slowed from its earlier peak. Real income growth has turned slightly positive again as inflation normalises, underpinning household spending, while financing conditions, though tighter than in the pre‑hiking era, remain consistent with a gradual expansion in credit to households and firms.
- Business sentiment is mixed, reflecting uncertainty around global trade, the policy outlook in the United States, and the potential impact of future tariff or industrial policy shifts. At the same time, easing supply‑chain costs and a relatively competitive euro exchange rate versus major trading partners provide support to manufacturing and export‑oriented sectors at the margin.
- The Governing Council is expected to reiterate that future decisions will remain data-dependent and taken meeting by meeting, based on an integrated assessment of the inflation outlook, the dynamics of underlying inflation, and the strength of monetary policy transmission. Officials have recently stressed that both further hikes and eventual cuts remain contingent on incoming data, implying no commitment to a particular path and a readiness to adjust if inflation or growth diverge materially from baseline projections.
- Balance sheet normalisation is set to continue gradually and predictably, with the stock of assets under the APP and PEPP declining as reinvestments have already been halted or scaled back in line with prior guidance. The ECB is expected to confirm that the current pace of portfolio runoff remains appropriate, supporting a slow withdrawal of monetary accommodation without disrupting market functioning.
- The next meeting is on 4 to 5 January 2026
Next 24 Hours Bias
Medium Bullish
The Swiss Franc (CHF)
Key news events today
No major news event
What can we expect from CHF today?
The Swiss franc holds steady with safe-haven appeal, bolstered by the SNB’s recent rate hold at 0% and optimistic tariff developments, while USD sags on Fed dovishness and liquidity injections; USD/CHF hovers near 0.7966 amid low volatility and no fresh Swiss data. No major economic releases are scheduled for CHF on December 17 per calendars, leaving focus on broader USD weakness from Fed liquidity measures and US data like rising jobless claims.
Central Bank Notes:
- At its 11 December 2025 monetary policy assessment, the Swiss National Bank (SNB) is widely expected to leave the policy rate unchanged at 0%, extending the pause that began in September as the Governing Board judges that current settings are sufficient to keep inflation near, but still below, its target while avoiding an unnecessary move into negative rates.
- Recent data show that the tentative rebound in Swiss inflation has stalled, with headline CPI easing from 0.1% year‑on‑year in October to 0.0% in November and core inflation slipping to about 0.4%, reinforcing the view that underlying price pressures remain very weak and that deflation risks, while contained, have not fully disappeared.
- The SNB’s conditional inflation forecast is likely to remain close to the September projections, with inflation still seen averaging roughly 0.2% in 2025, 0.5% in 2026, and 0.7% in 2027 under an unchanged policy rate path, though the latest CPI prints argue for a slightly lower near‑term profile and keep open the option of renewed easing if activity or prices weaken further.
- The global backdrop has deteriorated further, as continuing U.S. tariff actions and softer external demand weigh on world trade, while uncertainty in key European and U.S. markets for Swiss exports persists, leaving the SNB cautious about the growth outlook despite Switzerland’s relatively resilient domestic demand.
- Business and labour-market sentiment in export‑oriented manufacturing remains subdued, with firms reporting pressure on margins from the still‑strong franc and softer foreign orders, although the broader economy is still expected to grow at around 1–1.5% in 2025 and unemployment only drifting up gradually from low levels.
- The SNB continues to stress its willingness to act if deflation risks re‑emerge, reiterating that it can ease policy through renewed rate cuts or targeted foreign‑exchange intervention if necessary, while also highlighting its commitment to transparent communication, including the publication of detailed minutes from recent assessments and ongoing dialogue with international partners on FX policy
The next meeting is on 19 March 2026.
Next 24 Hours Bias
Medium Bullish
The Pound (GBP)
Key news events today
CPI y/y (7:00 am GMT)
What can we expect from GBP today?
The pound edged higher to near 1.3425 versus the USD, driven by robust UK PMI optimism and softer domestic labour trends that reduced immediate BoE rate cut bets, though traders eyed CPI data for fresh direction amid global safe-haven flows. GBP/USD climbed above 1.3400 early in the Asian session, supported by positive UK economic indicators like PMI beats, though it faced resistance near 1.3415.
Central Bank Notes:
- The Bank of England’s Monetary Policy Committee (MPC) will meet on 18 December 2025, with the current Bank Rate standing at 4.00 per cent after being held in a close 5–4 vote at the 5 November meeting. Market pricing and analyst commentary point to a high risk of a 25‑basis‑point cut to 3.75 per cent, but this remains conditional on incoming inflation and labour‑market data, so the December note should be treated as pre‑decision guidance rather than an ex‑post summary.
- The BoE is expected to leave its quantitative tightening (QT) framework broadly unchanged through year‑end, maintaining the lower reduction pace in gilt holdings that was set earlier in 2025. Official communications still characterise the existing QT path as consistent with a restrictive stance, with policymakers stressing that balance‑sheet reduction will remain gradual and sensitive to market‑liquidity conditions.
- Headline CPI inflation eased to 3.6 per cent year‑on‑year in October 2025, down from 3.8 per cent in September, helped by softer energy and goods prices, though it remains almost twice the 2 per cent target. Underlying inflation pressures, particularly in services, have continued to moderate only slowly, so the MPC’s central projection still envisages inflation moving closer to, but not yet reaching, 3 per cent over the course of 2026, contingent on further normalisation in energy and wage dynamics.
- UK economic activity remains weak heading into the December meeting, with the labour market showing further signs of slackening. The unemployment rate has risen toward just above 5 per cent on the latest three‑month figures to October, while overall regular pay growth has slowed to around the mid‑4 per cent range, reinforcing the view that domestic cost pressures are gradually easing.
- External conditions continue to cloud the outlook, with fragile global growth and fluctuating commodity prices contributing to bouts of financial‑market volatility. The MPC has highlighted that renewed global energy or food price shocks could temporarily slow the pace of disinflation, but such risks are currently judged unlikely to derail the medium‑term downward trajectory for inflation if domestic demand stays subdued.
- The balance of risks around the inflation outlook remains finely poised. Downside risks are linked to persistently weak domestic demand and rising unemployment, while upside risks come from still‑elevated inflation expectations, sticky services inflation, and the possibility that structural changes in the labour market leave less slack than conventional indicators suggest.
- Overall, the MPC’s stance going into December is restrictive but increasingly open to a gradual easing cycle, with any rate cuts expected to be measured and data‑dependent. Policymakers have reiterated that the Bank Rate will need to stay in restrictive territory until they are confident inflation is on a sustainable path back to the 2 per cent target, and they have signalled that the profile of cuts, once started, is likely to be shallow rather than rapid.
- The next meeting is on 5 February 2026.
Next 24 Hours Bias
Medium Bullish
The Canadian Dollar (CAD)
Key news events today
BOC Gov Macklem Speaks (5:45 pm GMT)
What can we expect from CAD today?
The Canadian dollar steadied near three-month highs around 1.376 USD/CAD, extending recent gains following cooler US jobs data, stable 2.2% CPI, and trade resilience, although oil weakness and global risk factors capped the upside forecasts eye 1.38 in the short term.
Central Bank Notes:
- The Governing Council left the target for the overnight rate unchanged at 2.25% at its 10 December 2025 meeting, in line with market expectations and signalling that the earlier easing cycle has likely concluded. The Bank noted that while global tariff tensions and trade uncertainty persist, the external backdrop has stabilised somewhat, reducing the need for additional insurance cuts even as world trade remains fragile.
- The Council acknowledged that uncertainty around U.S. trade policy and tariffs continues to weigh on business sentiment, but recent data show Canadian manufacturing and goods exports holding up better than anticipated. Surveys cited by the Bank suggest export order books have stopped deteriorating, with firms reporting some rebuilding of backlogs despite still‑cautious capital spending plans.
- Canada’s economy rebounded more strongly than expected in the third quarter, with real GDP expanding at an annualised pace of about 2.6% after a 1.8% contraction in Q2, largely on the back of higher crude exports and government spending. Monthly data show output rising 0.2% in September, though flash estimates point to a softer start to Q4 as some sectors give back earlier gains.
- Service sector activity has firmed, with indicators showing the services PMI back above the 50 threshold and broadening gains in business and professional services. However, consumer-facing categories remain mixed, as still‑elevated price levels and only modest real income growth keep a lid on discretionary spending even as tourism and technology‑related services expand.
- Housing markets have continued to stabilise, with national resale activity and prices edging higher through the autumn alongside the earlier decline in borrowing costs. The Bank noted that while some major urban centres are seeing renewed price pressures, tighter underwriting standards and still‑high affordability constraints are expected to cap the pace of any rebound.
- Headline CPI inflation eased to 2.2% year over year in October and is estimated to have remained near that rate in November, keeping it slightly above the 2% target but comfortably within the 1%–3% control range. Core measures have drifted lower, with CPI‑median and CPI‑trim around 3% or below, reinforcing the assessment that underlying price pressures are gradually moderating even as gasoline and some shelter components remain volatile.
- The Governing Council reiterated that the current policy rate is “about the right level” to keep inflation close to target while supporting the economy through a period of structural adjustment, and it signalled a shift away from near‑term easing expectations. While the Bank did not rule out future adjustments, officials stressed that, barring a material downside surprise to growth or inflation, further rate cuts are unlikely before 2026, and attention is now focused on the durability of the recovery and the evolution of core inflation.
- The next meeting is on 28 January 2026.
Next 24 Hours Bias
Medium Bullish
Oil
Key news events today
EIA Crude Oil Inventories (2:30 pm GMT)
What can we expect from Oil today?
Oil prices experienced volatility on December 17, 2025, rebounding from four-year lows near $55 per barrel for WTI crude amid a global supply glut and geopolitical shifts. President Donald Trump’s order for a blockade of sanctioned Venezuelan oil tankers sparked a rally, pushing WTI toward $56 and providing a temporary lift after prior session losses tied to oversupply concerns and hopes for a Russia-Ukraine peace deal easing Russian exports. Brent crude similarly attempted recovery from oversold levels around $59, though bearish trends persisted with prices below key moving averages.
Next 24 Hours Bias
Medium Bearish
The post IC Markets Global – Europe Fundamental Forecast | 17 December 2025 first appeared on IC Markets | Official Blog.