Articles
578 | +2.43% | 1 Setup | GBPJPY
29018 May 31, 2019 12:51 SwingFish Trading Room Journal GBPJPY
Mr. Tarif shaking the markets already pre-sessionFull Article

Gold aims for 100-day SMA as growing pessimism favors safe-havens
29142 May 31, 2019 12:33 FXStreet Market News
EUR/USD looks vulnerable amid trade war, German CPI eyed
29141 May 31, 2019 12:03 FXStreet Market News
USD/JPY drops to 2-week low as trade pessimism joins China PMI to strengthen risk-off
29139 May 31, 2019 11:53 FXStreet Market News
Friday 31st May: US announced a 5% tariff on all goods coming from Mexico; intensifying volatility in early trade.
29136 May 31, 2019 11:33 ICMarkets Market News
EUR/USD:
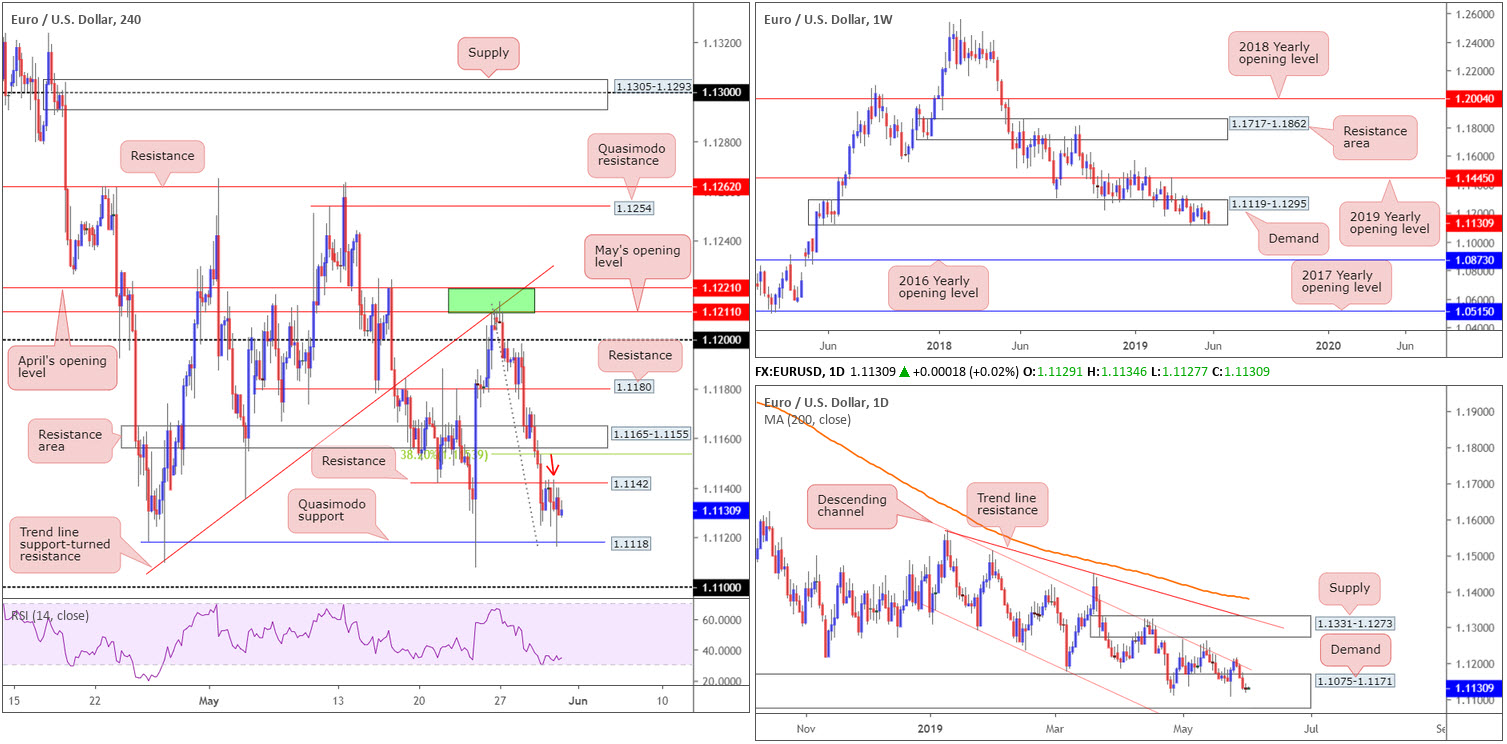
For traders who read Thursday’s morning brief you may recall the report underlined H4 resistance at 1.1142 (a Quasimodo support-turned resistance formation) as a potential area price may turn lower from (snippet taken from yesterday’s report):
Short-term movement (H4), on the other hand, offers a possible shorting opportunity from resistance at 1.1142 (a Quasimodo support-turned resistance formation), targeting Quasimodo support at 1.1118, followed closely by the 1.11 handle. Conservative traders anxious about selling into higher-timeframe demand may consider opting to wait for a H4 bearish candlestick pattern to form before pulling the trigger. This helps identify seller intent and also provides entry and risk levels to work with.
As is evident from the H4 chart, price eventually chalked up a H4 shooting star formation (red arrow) and swiftly tested the H4 Quasimodo support at 1.1118. However, by drilling down to the H1 timeframe, another shooting star pattern formed in early Asia (02.00 GMT+1) and provided far more appealing risk/reward conditions to 1.1118.
Overall, though, the market finished the day unchanged at -0.02%, with the daily timeframe printing a clear-cut indecision candle as a result. The US dollar index peaked at 98.28, before paring a large portion of intraday gains into the close.
From a higher-timeframe perspective, weekly price is challenging the lower limits of a long-standing demand at 1.1119-1.1295. A violation of this zone will likely register fresh 2019 lows and make a run for the 2016 yearly opening level at 1.0873. In similar fashion on the daily timeframe, we have demand coming in at 1.1075-1.1171 – glued to the underside of the current weekly demand – in motion. Although this area exhibits greater legroom before considered consumed, traders are urged to pencil in the support area at 1.0860-1.0954 (not seen on the screen) in the event we continue exploring lower ground.
Areas of consideration:
With sell orders likely consumed around the H4 resistance level at 1.1142, the only area of interest this morning is 1.1165-1.1155, a H4 resistance zone which happens to merge closely with a 38.2% Fibonacci resistance value at 1.1153. Do take into account this area may only offer a short-term bounce, potentially finding support around 1.1142, so ensure to consider risk/reward conditions before taking action.
Today’s data points: German Prelim CPI m/m; US Core PCE Price Index m/m; US Personal Spending m/m; Chicago PMI; US Revised UoM Consumer Sentiment; FOMC Member Williams Speaks.
GBP/USD:
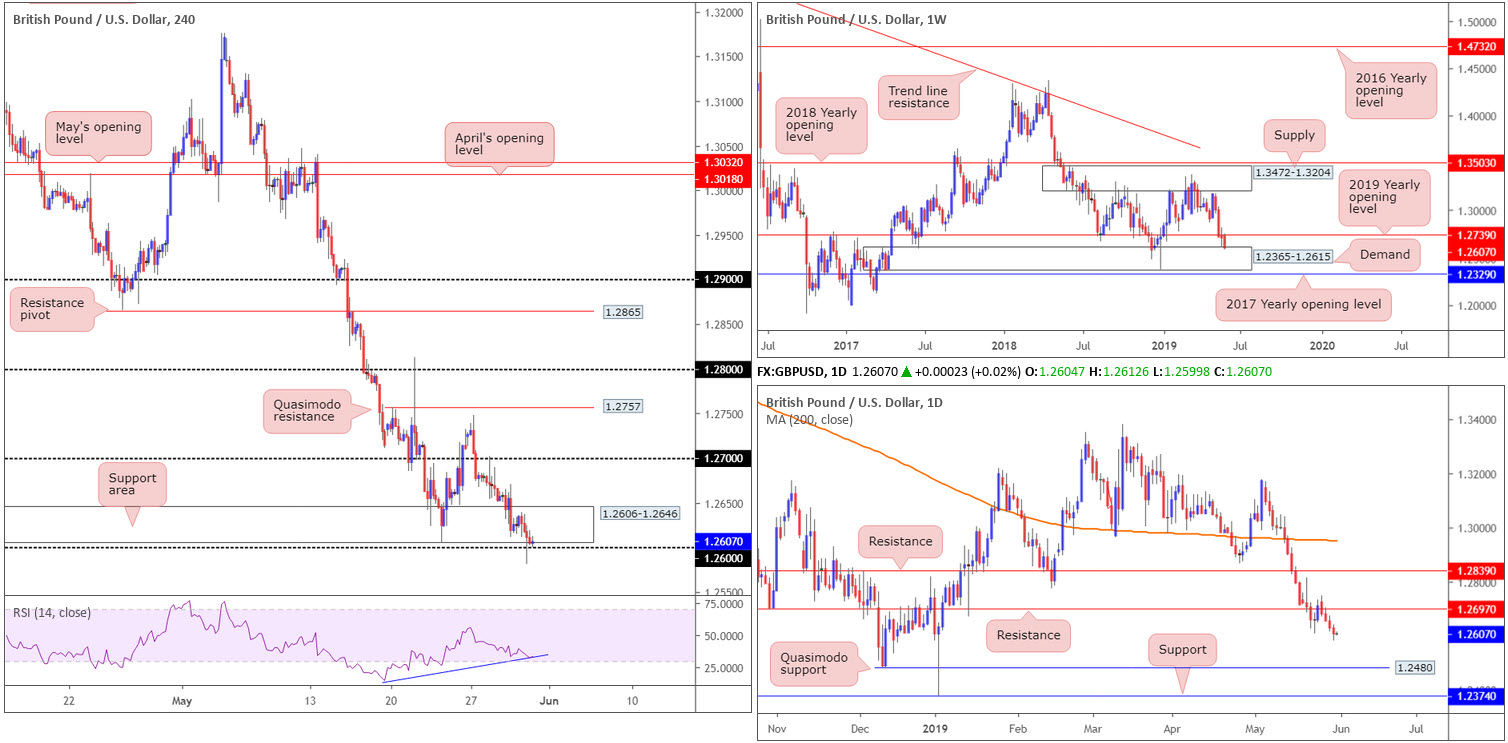
Largely emulating EUR/USD movement, the GBP/USD engulfed a H4 support area at 1.2606-1.2646 and confronted 1.26 as price headed into Thursday’s close.
In Thursday’s morning brief, the piece highlighted the following (potential) scenario:
Although some traders are likely looking to buy within the H4 support area at 1.2606-1.2646, given it has a connection with the top edge of weekly demand at 1.2365-1.2615, a fakeout through this area to the nearby 1.26 handle remains a possibility. This is likely due to diminished buying power from 1.2606-1.2646 from last week’s attempt at an advance (23rd) and the collection of stop-loss orders residing beneath it.
For that reason, conservative traders may wish to adopt a patient approach and wait and see if the candles are drawn to 1.26 before taking action. An ideal scenario would be for H4 price to print a hammer formation (or any notable bullish candlestick pattern) off 1.26, thus confirming buyer intent and simultaneously providing traders a structure to base entry and risk levels from.
With the above in mind, the market printed a half-hearted H4 hammer formation upon testing 1.26 yesterday and boasted RSI confirmation by way of positive divergence (blue line). In addition to this, as noted above, weekly demand is in motion from 1.2365-1.2615. The only drawback to a long from here, aside from the obvious downtrend in play at the moment, is daily flow continuing to extend its position beneath resistance at 1.2697, with room to potentially make a run for Quasimodo support priced in at 1.2480.
Areas of consideration:
For traders who wait for the high of a hammer pattern to be engulfed before pulling the trigger, a position has yet to be initiated. Those who entered on the close of the candle, however, with stop-loss orders plotted beneath the low of the formation (1.2580), are currently experiencing mild drawdown.
In the event the H4 candles turn higher from 1.26, 1.27 offers a logical take-profit target, given its close connection with daily resistance at 1.2697.
Today’s data points: US Core PCE Price Index m/m; US Personal Spending m/m; Chicago PMI; US Revised UoM Consumer Sentiment; FOMC Member Williams Speaks.
AUD/USD:
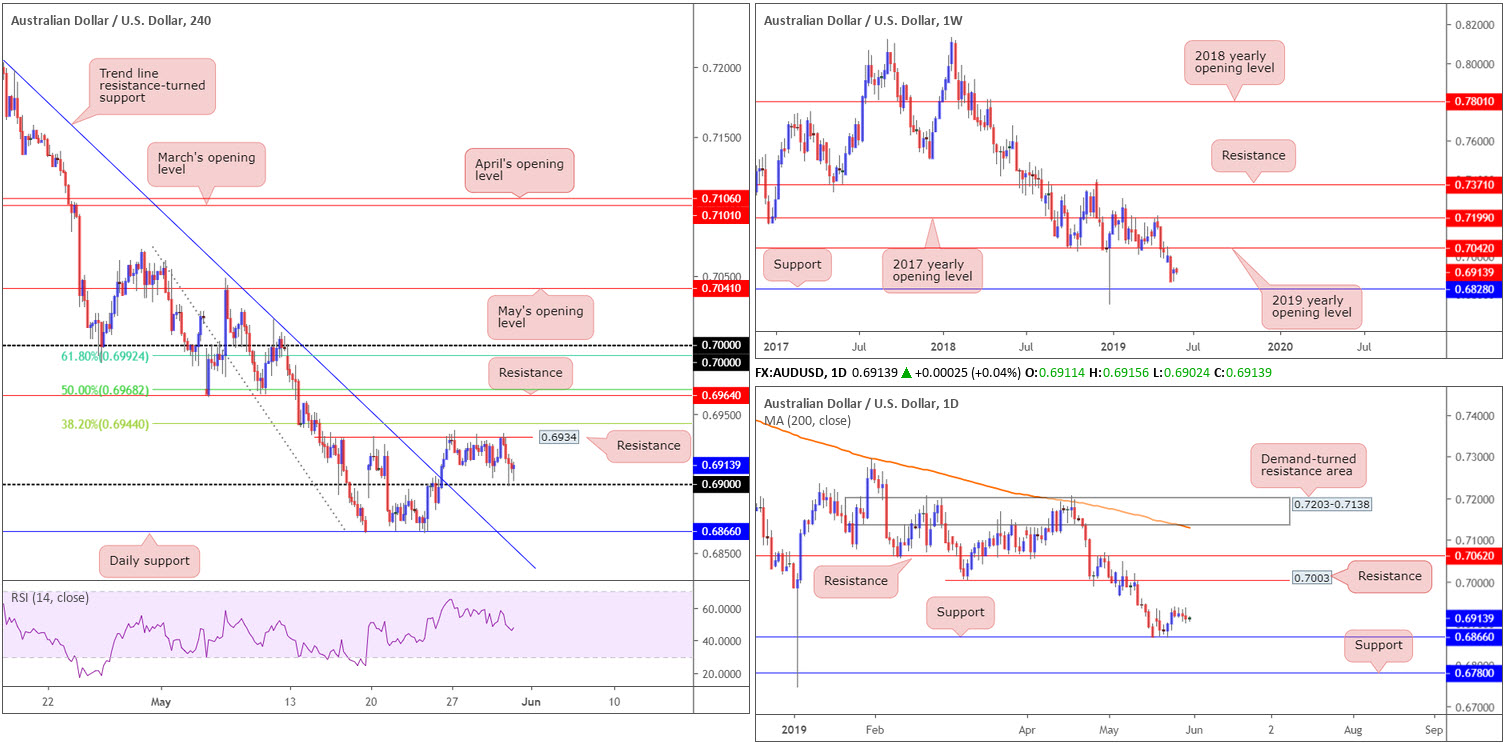
Lower-than-expected Australian building approvals m/m and private capital expenditure q/q triggered a bout of selling in early Asia Thursday, though was nothing to write home about. The market continued to press higher into London but encountered a familiar H4 resistance level at 0.6934, which held firm. The push from here eventually shook hands with the 0.69 handle and responded in the shape of a half-hearted H4 hammer pattern.
With buyers showing a lack of enthusiasm off 0.69 at the moment, focus is drawn to the daily support level at 0.6866, followed closely by a H4 trend line resistance-turned support taken from the high 0.7204. Should the unit turn higher from 0.69, nevertheless, it is worth keeping note of potential upside objectives above 0.6934:
- The 38.2% Fibonacci resistance at 0.6944.
- The 50.0% resistance value at 0.6968, which happens to align with resistance at 0.6964.
- The 61.8% Fibonacci resistance value at 0.6992 – lines up nicely with the key figure 0.70. Note also we have daily resistance offering a potential ceiling close by at 0.7003.
On more of a broader perspective, little has changed. Weekly price has eyes on 0.6828 as possible support, and resistance by way of the 2019 yearly opening level at 0.7042. Focus on the daily timeframe has now shifted to support establishing from the 0.6866 neighbourhood, with little in the way of resistance seen until connecting with 0.7003 (highlighted above). Beyond the two said levels, we have another layer of support residing around 0.6780 and an additional film of resistance at 0.7062.
Areas of consideration:
On account of the overall technical picture, the key figure 0.70 on the H4 timeframe remains of interest as potential resistance, though this is unlikely to be brought into the mix today.
Initially, our technical studies suggested 0.69 may offer traders a platform to buy from. While the base is holding ground, the interest seen from this level is not encouraging, despite the H4 hammer formation. Therefore, trade with caution.
Traders still interested in 0.69, however, are advised not to overlook the noted H4 resistances. In fact, the levels can be used to trail market action towards 0.70.
Today’s data points: China Manufacturing PMI; China Non-Manufacturing PMI; US Core PCE Price Index m/m; US Personal Spending m/m; Chicago PMI; US Revised UoM Consumer Sentiment; FOMC Member Williams Speaks.
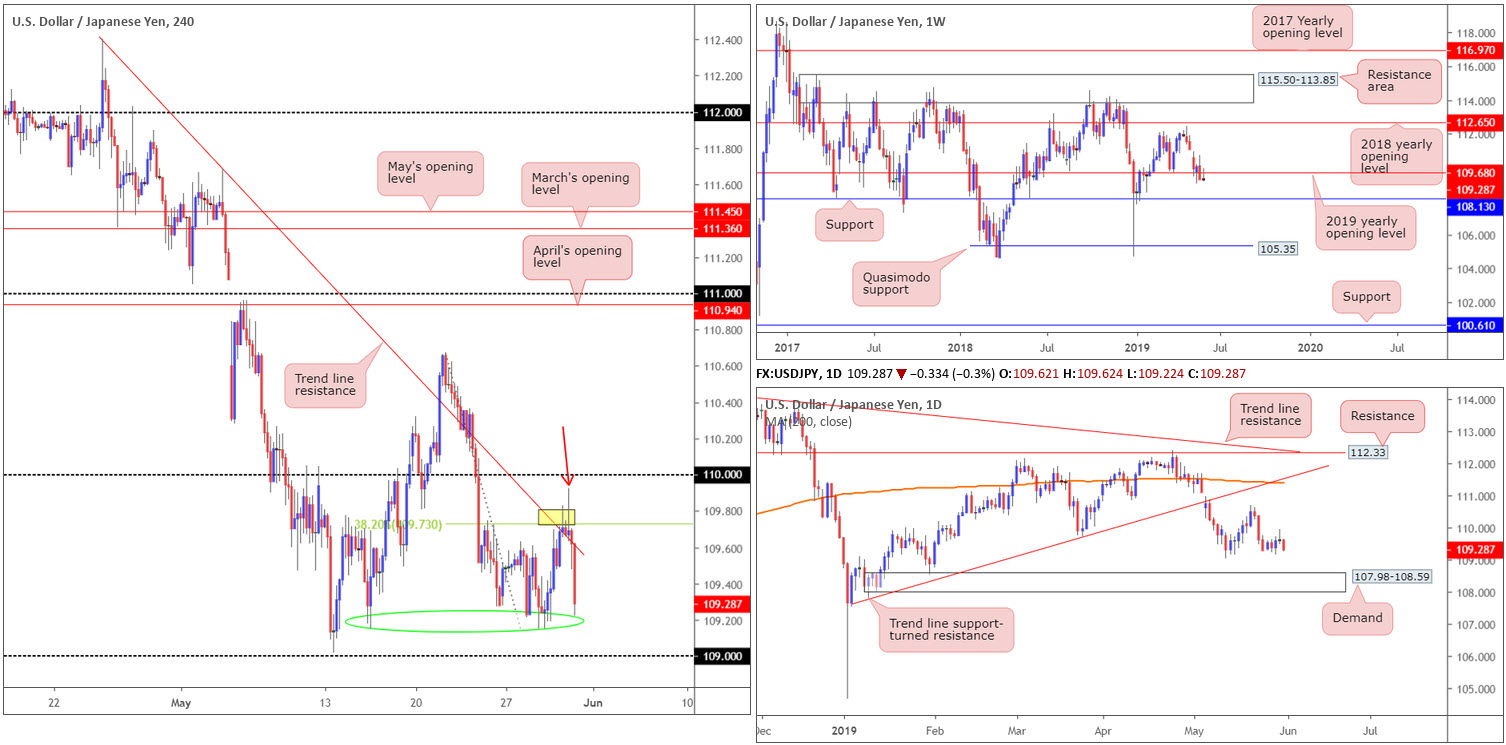
USD/JPY:
In opening trade this morning, investors witnessed Japan’s Nikkei 225 plunge lower, dragging the USD/JPY along with it. In times of uncertainty, the Japanese yen is considered a safe haven.
Technically, traders may recall Thursday’s briefing underlined the following:
109.73: the H4 38.2% Fibonacci resistance level is of interest today as a sell zone (yellow), having seen it unite closely with a H4 trend line resistance and the 2019 yearly opening level on the weekly timeframe.
The report also went on to state:
Aggressive traders may opt to enter at market at 109.73 with protective stop-loss orders plotted 10-15 points above the said trend line resistance. Conservative traders, nonetheless, might wait and see how H4 action responds and enter on the back of additional confirmation. This could be anything from a notable rejection: a full or near-full-bodied bearish candle, an MA crossover or even drilling down to the lower timeframes and entering based on local structure.
Aggressive traders in this case were taken out, though conservative traders who entered on the back of the large H4 shooting star formation (red arrow) are currently in stable profit.
Areas of consideration:
Traders short the market may find support emerge around 109.20 (green circle), though the next obvious downside target, according to our technical reading, is seen at the 109 handle. In addition to this, traders are urged to take higher-timeframe structure into consideration. Beyond the 109.01 May 13 low, we have a daily support area at 107.98-108.59, which happens to house weekly support at 108.13 within it lower boundary. The daily zone could be considered the ultimate downside target.
Today’s data points: US Core PCE Price Index m/m; US Personal Spending m/m; Chicago PMI; US Revised UoM Consumer Sentiment; FOMC Member Williams Speaks.
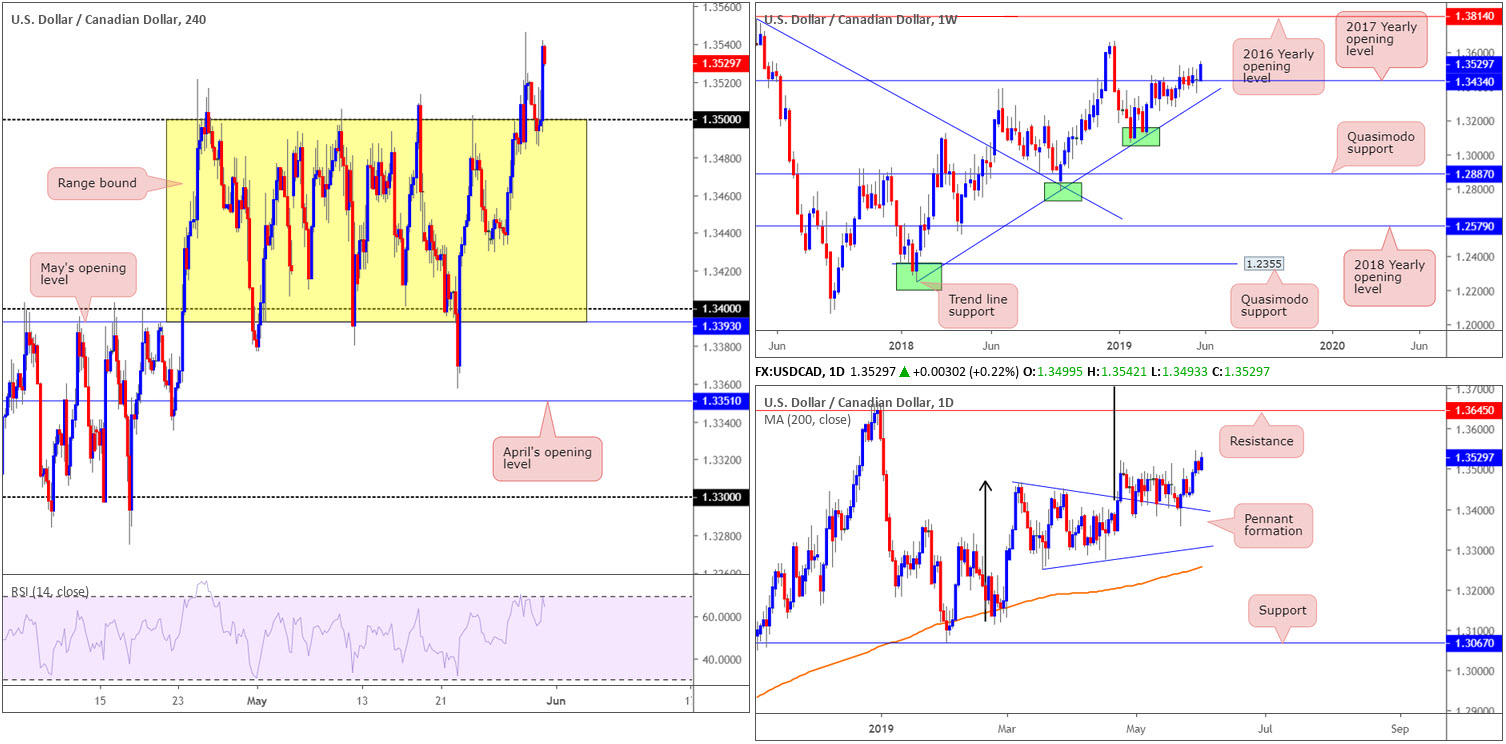
USD/CAD:
With WTI declining more than 4.00% and the US dollar index attempting to cross swords with its 2019 yearly high of 98.37 Thursday, the USD/CAD pair turned higher from 1.35 in recent trading.
For those who read Thursday’s briefing you may recall the research team stated the following:
According to our technical reading, traders have the choice of either buying the breakout candle above 1.35 and placing stop-loss orders beneath its lower shadow, or waiting and seeing if a retest scenario takes shape and entering on the back of the rejection candle’s structure. The next upside objective on the H4 scale can be seen around 1.3570 (not visible on the screen).
As is evident from the H4 chart, 1.35 has been respected as support and is testing highs of 1.3542, as we write.
Higher-timeframe flow has weekly price surging from the 2017 yearly opening level at 1.3434, targeting a possible run towards the 2018 yearly high of 1.3664. Daily action, after feeding off support drawn from the top edge of a pennant pattern (1.3467) for the past month, looks to also be heading higher. Although the traditional price target (calculated by taking the distance from the beginning of the preceding move and adding it to the breakout price) remains on the chart at 1.3768 (black arrows), the next upside target from a structural standpoint falls in around resistance at 1.3645.
Areas of consideration:
Well done to any of our readers who managed to enter long from 1.35. For conservative traders, there was actually a nice-looking H4 inverted hammer formation that took shape prior to price trading higher.
Unless we retest 1.35 for a second time, in which another buying opportunity may present itself, the research team sees little else to hang their hat on in terms of high-probability trading opportunities.
Today’s data points: US Core PCE Price Index m/m; US Personal Spending m/m; Chicago PMI; US Revised UoM Consumer Sentiment; FOMC Member Williams Speaks; Canadian GDP m/m; Canadian RMPI m/m.
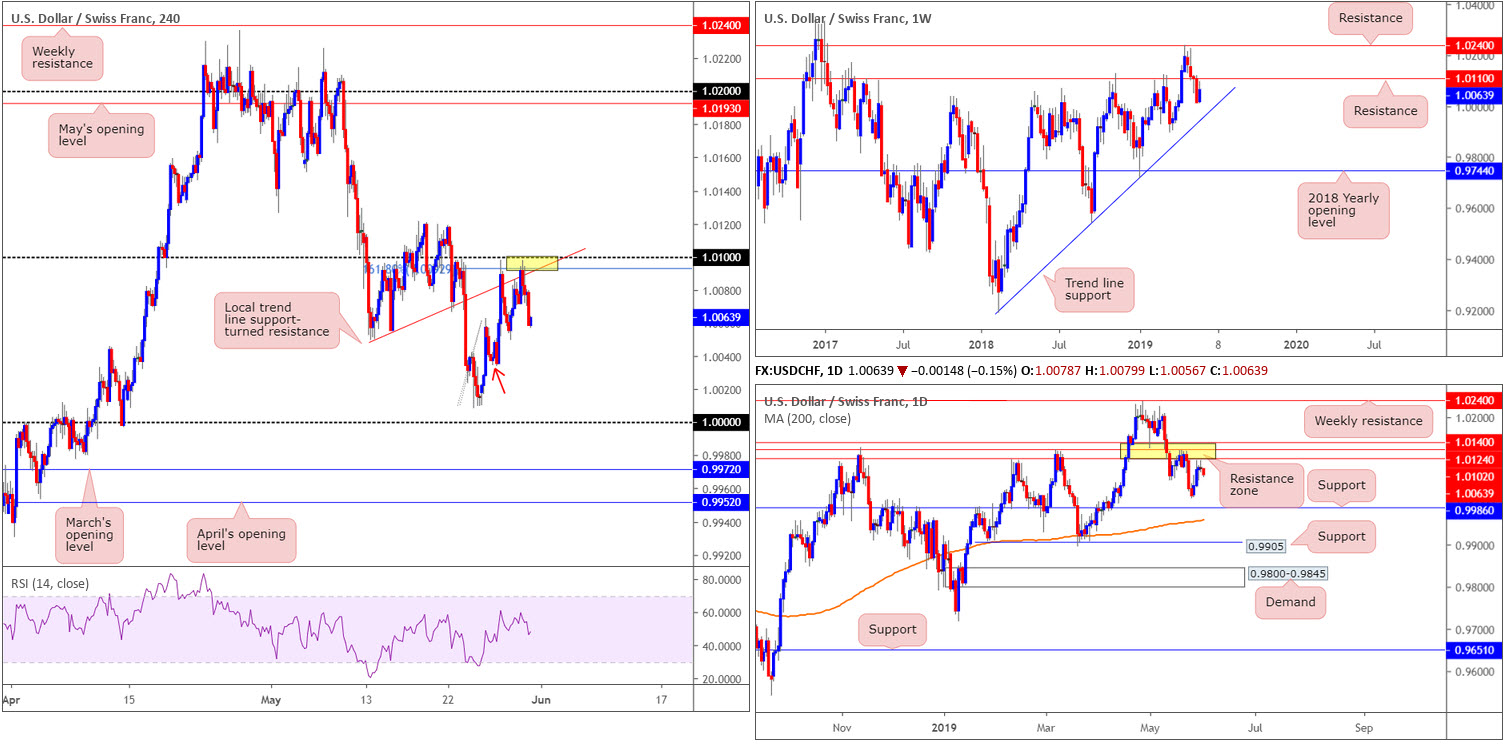
USD/CHF:
In recent sessions, the USD/CHF retested a particularly interesting area of H4 resistance at 1.01/1.0092 (comprised of the 1.01 handle, a H4 trend line support-turned resistance extended from the low 1.0069 and a H4 161.8% Fibonacci ext. point at 1.0092) and turned lower.
For folks who read Thursday’s briefing you may recall the piece highlighted 1.01/1.0092 as a potential sell zone. The research team favoured this area due to its close connection with the lower edge of the daily resistance zone at 1.0140/1.0102, which incorporates a weekly resistance at 1.0110.
Areas of consideration:
Well done to any of our readers who managed to sell 1.01/1.0092. Further selling from the H4 position has minor demand located around 1.0045ish (red arrow) to target, followed closely by the key figure 1.0000. Therefore, it may be an idea to consider reducing risk to breakeven at this point.
1.0000 is also likely an area on many traders’ watchlist for possible longs, as the number boasts additional backing from daily support at 0.9986.
Today’s data points: US Core PCE Price Index m/m; US Personal Spending m/m; Chicago PMI; US Revised UoM Consumer Sentiment; FOMC Member Williams Speaks.
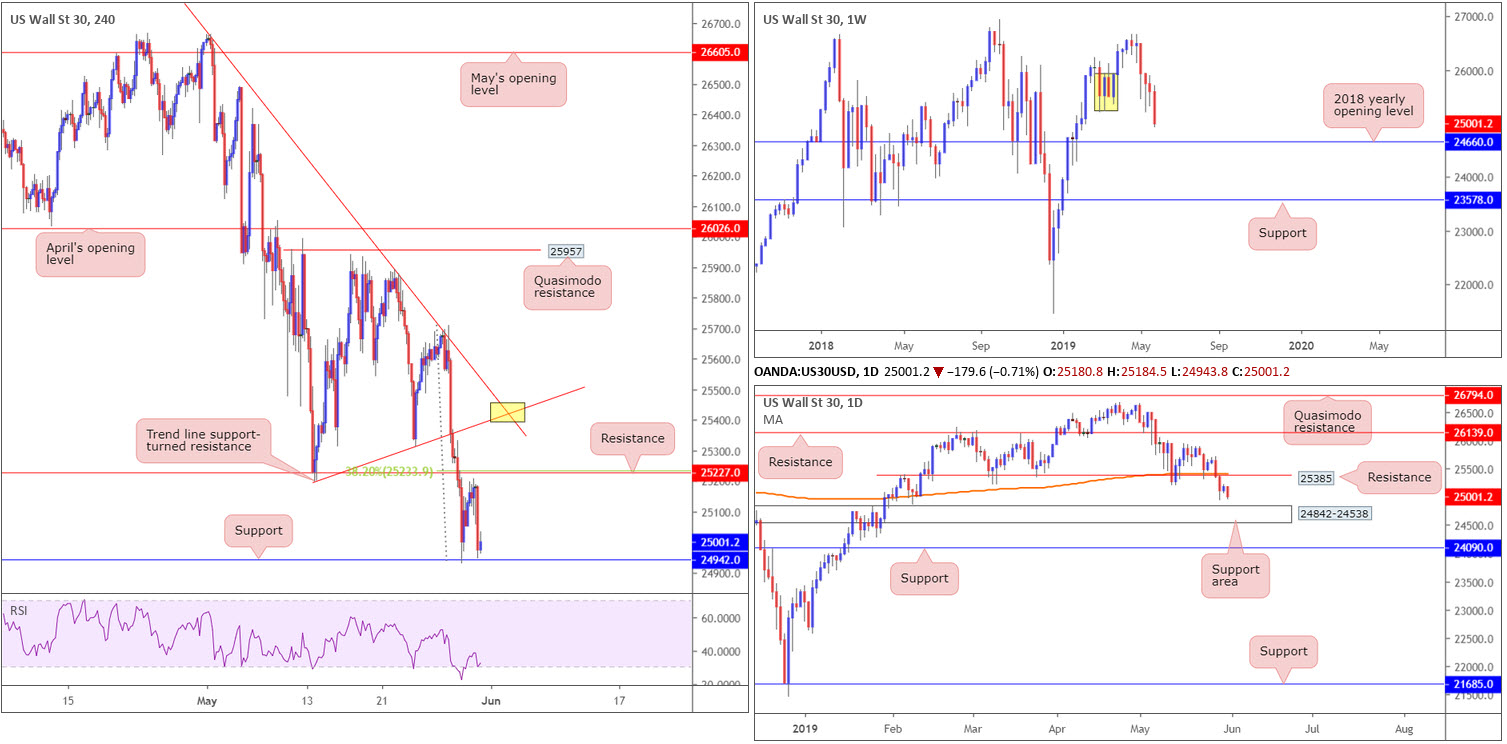
Dow Jones Industrial Average:
In recent hours, US President Trump announced a 5% tariff on all goods coming from Mexico beginning June 10th until illegal immigrants coming through Mexico to the US stop. This sent global equity indexes lower, with the Dow Jones Industrial Average recording losses of more than 0.8%.
Technically, the downside move has not been enough to overthrow H4 support located at 24942. However, with weekly price eyeing the 2018 yearly opening level at 24660 as its next viable support, and daily price targeting a support area coming in at 24842-24538, the current H4 support may eventually give way and make a run for support at 24674 (not visible on the screen).
Areas of consideration:
According to our higher-timeframe technical reading, the pendulum appears to be swinging in favour of the sellers at present. For that reason, focus remains on H4 resistance at 25227 for possible shorting opportunities, which happens to merge closely with a H4 38.2% Fibonacci value at 25233. In addition to this, traders may also find the H4 converging trend line resistances (upper yellow box – 26659/25198) of use for shorts in the event we overthrow 25227. Ultimately, the first downside target from either resistance highlighted above is H4 support at 24942, followed by the daily support area at 24842-24538.
Further adding to the above, traders may also want to keep an eye open for a break beneath the current H4 support mentioned above at 24942 for shorts. The next downside target from here falls in around the top edge of the daily support area at 24842-24538, which holds both the H4 support at 24674 and the 2018 yearly opening level on the weekly timeframe at 24660 within.
Today’s data points: US Core PCE Price Index m/m; US Personal Spending m/m; Chicago PMI; US Revised UoM Consumer Sentiment; FOMC Member Williams Speaks.
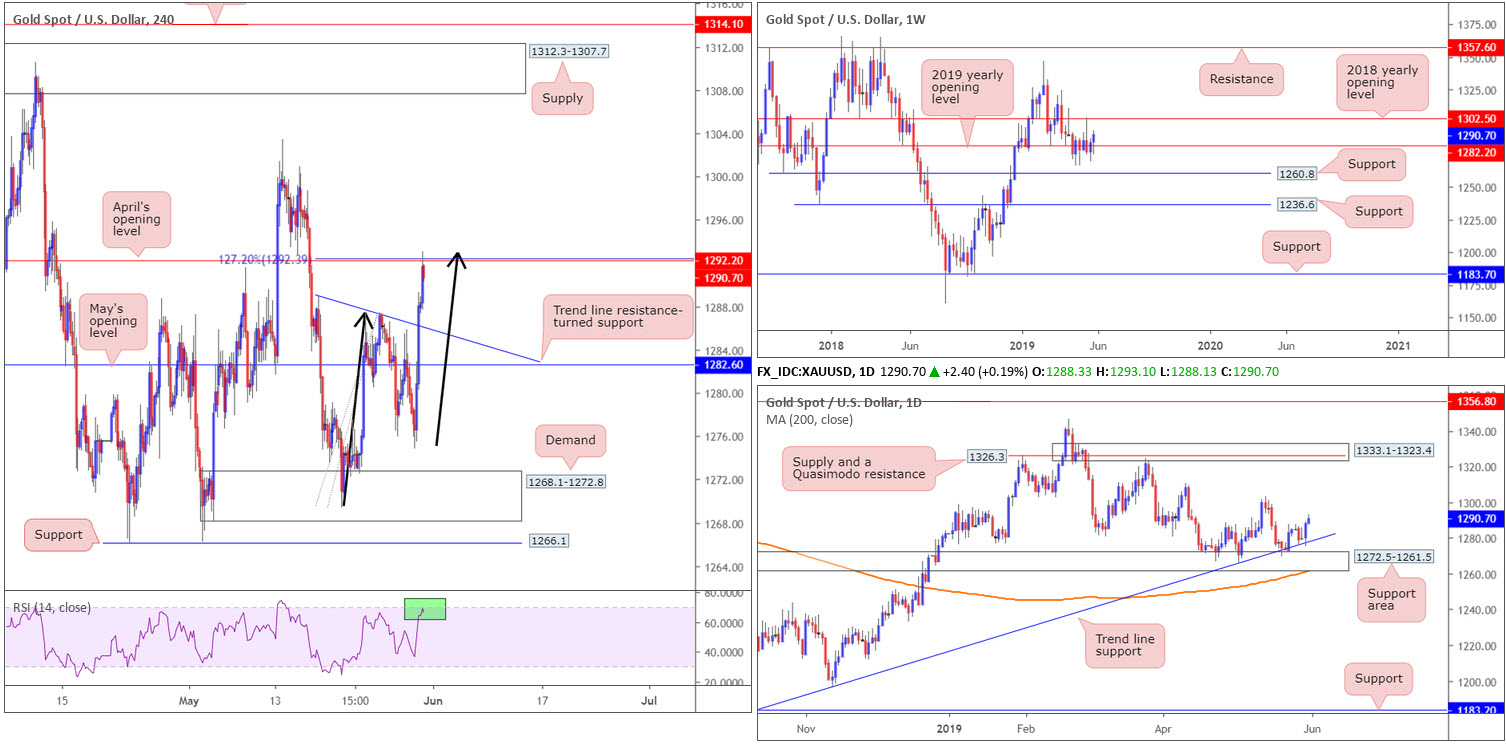
XAU/USD (GOLD):
With the US dollar index retreating from a peak of 98.28, just south of the 2019 yearly high of 98.37, bullion turned higher Thursday, up 0.66% on the day.
Buying on the H4 timeframe so far meets the characteristics of a strong AB=CD (black arrows) 127.2% bearish pattern that completes at 1292.3. Also supporting this region is April’s opening level at 1292.2 and the RSI indicator nearing overbought status (green). By and of itself, this is likely enough to entice sellers into the market, targeting a move towards a local trend line resistance-turned support (extended from the high 1288.9).
Before pressing the sell button, though, traders are urged to consider the higher-timeframe landscape. Weekly movement is making good ground above its 2019 yearly opening level at 1282.2, with the next upside hurdle visible at 1302.5: the 2018 yearly opening level. In terms of daily action, the unit is seen rebounding higher from a trend line support taken from the low 1160.3, eyeing a possible run in the direction of the 1303.4 May 14 high.
Areas of consideration:
Despite higher timeframes portending a move higher, a rotation south from April’s opening level on the H4 timeframe at 1292.2 is still a strong possibility, knowing the approach terminated in the shape of a H4 AB=CD bearish formation.
For conservative traders concerned about the bigger picture, one option is to wait and see how H4 action behaves before pulling the trigger. This could be something as simple as a H4 bearish candlestick pattern, a moving average crossover or even drilling down to the lower timeframes and attempting to trade local structure. What this does is help identify seller intent and also provide traders levels to enter and base stop-loss orders from.
The accuracy, completeness and timeliness of the information contained on this site cannot be guaranteed. IC Markets does not warranty, guarantee or make any representations, or assume any liability with regard to financial results based on the use of the information in the site.
News, views, opinions, recommendations and other information obtained from sources outside of www.icmarkets.com.au, used in this site are believed to be reliable, but we cannot guarantee their accuracy or completeness. All such information is subject to change at any time without notice. IC Markets assumes no responsibility for the content of any linked site. The fact that such links may exist does not indicate approval or endorsement of any material contained on any linked site.
IC Markets is not liable for any harm caused by the transmission, through accessing the services or information on this site, of a computer virus, or other computer code or programming device that might be used to access, delete, damage, disable, disrupt or otherwise impede in any manner, the operation of the site or of any user’s software, hardware, data or property.
Ex-China Vice CommerceMin: Need to prepare for the trade war to spread to geopolitical areas
29135 May 31, 2019 11:33 FXStreet Market News
US Iran Envoy: Countries buying Iranian oil will be subject to sanctions
29134 May 31, 2019 11:03 FXStreet Market News
China said to have a plan ready to limit rare earth sales to the US if necessary, JPY rises further
29133 May 31, 2019 10:53 FXStreet Market News
Ex-PBOC Chief Dai believes there’ll be good news from China-US trade talks in Japan
29128 May 31, 2019 10:33 FXStreet Market News
GBP/USD technical analysis: 50-HMA can toughen road to recovery
29127 May 31, 2019 10:03 FXStreet Market News
Bank of Korea maintains the status-quo in May amid US-China trade war
29126 May 31, 2019 09:53 FXStreet Market News
AUD/JPY: Dumps towards swing lows on knee jerk to Mexican tariff noise
29125 May 31, 2019 09:33 FXStreet Market News