Articles

EUR/USD comes under pressure near 1.1750
126789 March 31, 2021 21:45 FXStreet Market News
- EUR/USD deflates from daily highs near 1.1750 on Wednesday.
- EMU’s flash CPI came in at 0.9% MoM, 1.3% YoY in March.
- US ADP report missed expectations at 517K last month.
After hitting daily tops near 1.1750, EUR/USD met some selling pressure and now returns to the 1.1720 area, up smalls for the day so far.
EUR/USD bounces off YTD lows near 1.1700
EUR/USD so far manages to reverse the recent strong downside to the 1.1700 neighbourhood, or fresh 2021 lows, recorded during early trade on Wednesday.
Despite the current rebound, the single currency stays under pressure, as investors continue to favour the dollar on the back of rising US yields, the US strong economic recovery supported by the firm vaccine rollout and prospects of higher fiscal spending in the next months.
On another front, ECB’s Chairwoman C.Lagarde “challenged” markets earlier on Wednesday after hinting at the idea that the central bank is ready to face investors’ tests. She also stressed that the ECB will give sufficient notice before any modification of the ongoing stimulus measures.
In the domestic calendar, the German Unemployment Rate stayed at 6.0% and the Unemployment Change went down by 8K, all for the month of March. Further data saw EMU’s preliminary inflation figures now expecting the headline CPI to rise 0.9% inter-month and 1.3% on a year to March.
Across the ocean, the ADP report came in short of estimates at 517K during last month.
What to look for around EUR
EUR/USD meets some decent support in the 1.1700 neighbourhood so far this week. The strong pullback in the pair came along the persistent bid bias of the greenback, which has been undermining the constructive view in the pair in the past weeks. The deterioration of the morale in Euroland coupled with the poor pace of the vaccine rollout in the region and the outperformance of the US economy (vs. its G10 peers) have all been collaborating with the renewed offered stance around the single currency. However, the steady hand from the ECB (despite some verbal concerns) in combination with the expected rebound of the economic activity in the region in the post-pandemic stage is likely to prevent a much deeper pullback in the pair in the longer run.
Key events in the euro area this week: German Retail Sales, final PMIs in the euro area (Thursday).
Eminent issues on the back boiler: Asymmetric economic recovery in the region. Sustainability of the pick-up in inflation figures. Progress of the vaccine rollout. Probable political effervescence around the EU Recovery Fund.
EUR/USD levels to watch
At the moment, the index is gaining 0.16% at 1.1732 and a breakout of 1.1864 (200-day SMA) would target 1.1989 (weekly high Mar.11) en route to 1.2000 (psychological level). On the flip side, the next support emerges at 1.1704 (2021 low Mar.31) seconded by 1.1602 (monthly low Nov.4) and finally 1.1572 (2008-2021 support line).
Full Article
ECB’s Villeroy: EU governments need to implement recovery plan urgently
126788 March 31, 2021 21:33 FXStreet Market News
The European policymakers’ main issue now is not the scale of the fiscal response but the speed of its execution, European Central Bank (ECB) Governing Council member François Villeroy de Galhau said on Wednesday, as reported by Reuters.
“Speed, once more, is our collective handicap,” Villeroy added. “Governments now need to implement the recovery plan to which they have agreed and they need to do so urgently.”
Market reaction
The EUR/USD pair largely ignored these comments and was last seen posting small daily gains at 1.1728.
Full Article
IMF: Global economic output to be 3% lower in 2024 than pre-pandemic projections
126787 March 31, 2021 21:12 FXStreet Market News
The International Monetary Fund (IMF) said on Wednesday that the global economic output is expected to be about 3% lower in 2024 than projections that were made before the coronavirus pandemic, as reported by Reuters.
“Systemic financial stress is largely avoided in COVID-19 crisis but the recovery is still challenging for some countries,” the IMF further noted in a blog post summarizing its updated World Economic Outlook report.
“Unlike what happened during the global financial crisis, emerging market and developing economies are expected to have deeper scars than advanced economies, with losses expected to be the largest among low-income countries,” it added.
Market reaction
The market mood was largely unaffected on this headline and the S&P 500 futures were last seen gaining 0.18% on a daily basis.
Full Article
NZD/USD edges higher to 0.7000 area after US ADP jobs report
126786 March 31, 2021 21:05 FXStreet Market News
- NZD/USD is posting modest daily gains on Wednesday.
- US Dollar Index continues to move sideways above 93.00.
- Private sector employment in US increased by 517,000 in March.
The NZD/USD pair extended its rebound and touched a daily high of 0.7005 in the early trading hours of the American session. As of writing, the pair was trading at 0.6997, rising 0.22% on a daily basis.
ADP employment data fails to boost USD
The monthly data published by the Automatic Data Processing (ADP) Research Institute showed on Wednesday that employment in the US private sector rose by 517,000 in March. Although this reading came in lower than the market expectation of 550,000, it was still a big improvement from February’s increase of 176,000.
Nevertheless, the greenback showed no immediate reaction to this data and the US Dollar Index (DXY) was last seen posting small daily losses at 92.23.
Later in the day, the ISM Chicago’s Purchasing Managers’ Index data for March and February Pending Home Sales will be looked upon for fresh impetus. Additionally, US President John Biden will unveil the $2 trillion infrastructure plan at 2020 GMT.
In the meantime, the S&P 500 Futures are up 0.16% on the day, suggesting that the DXY could have a tough time regaining its traction if Wall Street’s main indexes start pushing higher in the second half of the day.
On Thursday, the only data release from New Zealand will be Roy Morgan Consumer Confidence Index for March.
Technical levels to watch for
Full Article
US Dollar Index struggles for direction above 93.00
126785 March 31, 2021 21:05 FXStreet Market News
- DXY corrects lower after earlier 2021 highs near 93.50.
- The ADP report surprised to the upside at 450K in March.
- President Biden’s speech will be the salient event later in the session.
The greenback keeps the inconclusive price action above the 93.00 mark when tracked by the US Dollar Index (DXY) on Wednesday.
US Dollar Index eases from YTD peaks near 93.50
The index met quite a decent resistance near 93.50 earlier in the session, levels last visited back in November 2020 amidst month-end flows, profit taking mood and a moderate bias towards the risk-associated assets.
The downside in the dollar, however, is expected to be corrective only, as US yields keep the firm note despite trading off recent lows in the proximity of the 1.80% level on Tuesday.
In the US docket, the ADP report showed the US private sector added 517K jobs in March, a tad below consensus albeit markedly higher than February’s revised 176K. These results add to the already high optimism ahead of the publication of Friday’s Nonfarm Payrolls.
Later in the session, the Chicago PMI is due followed by February’s Pending Home Sales and the usual EIA’s report on US crude oil inventories.
What to look for around USD
The upside momentum in the dollar looks well and sound and the index continue to consolidate the recent breakout of the 93.00 barrier, or new YTD tops. Supporting this idea, the recent breakout of the 200-day SMA seems to bolster the now constructive view on the buck, at least in the near-term. In addition, the recently approved fiscal stimulus package adds to the ongoing outperformance of the US economy narrative as well as the investors’ perception of higher inflation in the next months, all morphing into extra oxygen for the buck. However, the mega-accommodative stance from the Fed (until “substantial further progress” in inflation and employment is made) and hopes of a strong global economic recovery (now postponed to later in the year) remain a source of support for the risk complex and carry the potential to curtail the upside momentum in the dollar in the longer run.
Key events in the US this week: ADP Report, President Biden’s speech (Wednesday) – Initial Claims, ISM Manufacturing (Thursday) – Nonfarm Payrolls (Friday).
Eminent issues on the back boiler: Biden’s new stimulus bill worth around $3 trillion. US-China trade conflict under the Biden’s administration. Tapering speculation vs. economic recovery. US real interest rates vs. Europe. Could US fiscal stimulus lead to overheating? Future of the Republican party post-Trump acquittal.
US Dollar Index relevant levels
At the moment, the index is losing 0.05% at 93.25 and faces the next support at 92.50 (200-day SMA) followed by 91.30 (weekly low Mar.18) and then 91.22 (50-day SMA). On the upside, a break above 93.43 (2021 high Mar.31) would expose 94.00 (round level) and finally 94.30 (monthly high Nov.4).
Full Article
Top 3 Price Prediction Bitcoin, Ethereum, Ripple: Skepticism soars as Bitcoin wobbles from $60,000
126781 March 31, 2021 21:02 FXStreet Market News
- Bitcoin pivotal at $58,000 after incurring brief losses from highs near $60,000.
- Ethereum is hovering at $1,800 following rejection from $1,850.
- Ripple seeks support at 50 SMA on four-hour chart to avert declines heading to $0.4.
Bitcoin dropped sharply and briefly during the European session on Wednesday, leaving many retail investors liquidated. Over the last few days, BTC and Ethereum tried to lift above key levels at $60,000 and $1,800, respectively, but struggled to sustain the gains.
Ethereum is dancing roughly at $1,800 at the time of writing, while Bitcoin is pivotal at $58,000. The cross-border token Ripple has lost approximately 5% of its value to trade at $0.55. Most cryptocurrencies are in the red apart from some selected altcoins such as Filecoin, BitTorrent and Holo.
Bitcoin eyes technical breakdown to $52,000
Bitcoin has printed a rising wedge pattern on the four-hour chart. This is a bearish pattern molded by two rising trend lines connecting the asset’s higher highs and higher lows. The pattern is distinct, because it contracts to the upside as the trading range narrows.
Contrary to the symmetrical triangles, which have no bearish or bullish bias, a rising wedge pattern usually results in a breakdown. For instance, BTC may drop by 10% to test support at $52,000.
Various support levels are in line to provide anchorage, including the 100 Simple Moving Average (SMA) on the four-hour chart near $56,000, the 50 SMA close to $55,400, and the 200 SMA holding around $53,840.

BTC/USD four hour chart
It is worth mentioning that Bitcoin may ignore the pessimistic outlook if it manages to hold above $58,000. Market stability is likely to build at this position as buyers shift their focus to levels past $60,000.
Ethereum struggles to secure higher support
Ether made its way above $1,800, which seemed to have validated the anticipated upswing to $2,000 — however, a barrier at $1,850 cut short the uptrend, allowing bears to come into play. The pioneer smart contract token corrected back to $1,800 and is currently seeking support at this same level.
The four-hour Moving Average Convergence Divergence (MACD) indicator is about to flip massively bearish. Investors would be inclined to sell if the MACD line (blue) crosses under the signal line. This may send Ether under $1,800, triggering massive losses toward the support highlighted by the 100 SMA around $1,750.
If push comes to shove and Ethereum fails to secure higher support, declines will likely increase to the buyer congestion around $1,665 as discussed. The bearish leg may also extend to the primary anchor at $1,540, whereby bulls will stage a significant upswing.
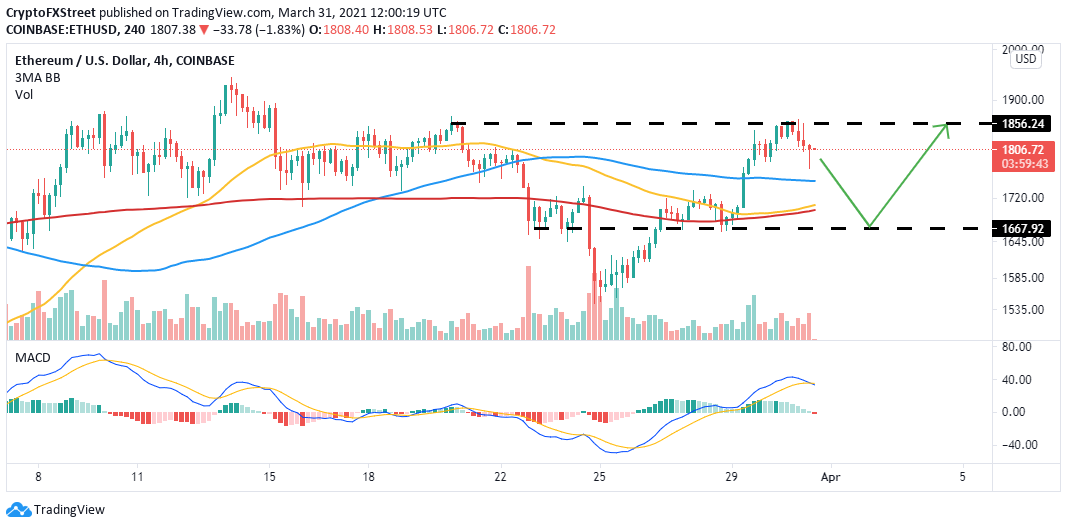
ETH/USD 4-hour chart
Ripple resumes downtrend as overhead pressure shoots
The international remittance token has retreated from the stubborn hurdle at $0.6 to trade at $0.54. The 50 SMA on the four-hour chart provides immediate support. Closing the day beneath this zone would validate the downtrend toward $0.5.
Meanwhile, the MACD has dived toward the mean line and is likely to cross into the negative territory. Additionally, the MACD line (blue) has increased the signal line’s divergence, adding weight to the bearish outlook.
The 100 SMA and the 200 SMA provide support at $0.51 and $0.48, respectively. However, XRP’s primary support is at $0.4 and $0.35.

XRP/USD 4-hour chart
On the other hand, holding above the 50 SMA for the rest of the day would encourage more buyers to join the market. An increase in the tailwind would bolster Ripple toward $0.6. Trading past this stubborn resistance is likely to pave the way for gains eyeing $0.65 and $0.75 in the order.
Full Article
USD/CAD keeps the red near 1.2600 mark post-US/Canadian macro releases
126780 March 31, 2021 20:56 FXStreet Market News
- USD/CAD witnessed some selling on Wednesday and erased the overnight gains to three-week tops.
- A modest USD profit-taking turned out to be a key factor that exerted some pressure on the major.
- The US ADP report and the monthly Canadian GDP print did little to provide any meaningful impetus.
The USD/CAD pair maintained its offered tone through the early North American session and had a rather muted reaction to the US/Canadian macro releases. The pair was last seen hovering near the 1.2600 mark, down around 0.30% for the day.
The pair came under some renewed selling pressure on Wednesday and eroded a major part of the previous day’s positive move to near three-week tops. This marked the first day of a negative move this week and was exclusively sponsored by a modest US dollar pullback from multi-month tops.
Having struggled to capitalize on the overnight spike to the highest level since January 2020, the yields on the benchmark 10-year US government bond remained depressed near 1.72%. This, in turn, seemed to be the only factor that prompted the USD bulls to take some profits off the table.
On the economic data front, the ADP report showed that the US private-sector employers added 517K jobs in March. The reading fell short of market expectations but was still well above February’s upwardly revised figure of 176K and added to the narrative of a relatively US economic recovery.
On the other hand, the monthly Canadian GDP came in to show that the economy expanded by 0.7% MoM in January as against 0.5% growth anticipated. The positive data, to a larger extent, was offset by a subdued action around oil prices, which tend to influence the commodity-linked loonie.
This, in turn, failed to impress traders or provide any meaningful impetus to the USD/CAD pair. Traders now seemed reluctant to place any aggressive directional bets, rather preferred to wait on the sidelines ahead of the OPEC+ meeting on Thursday and Friday’s US monthly jobs report (NFP).
In the meantime, the USD price dynamics will play a key role in influencing the USD/CAD pair. Hence, the key focus will be on the US stimulus headlines and US President Joe Biden’s speech at 20:20 GMT, elaborating details of the proposed $2.25 trillion infrastructure spending plan.
Technical levels to watch
Full Article
Canada Industrial Product Price (MoM): 2.6% (February) vs 2%
126779 March 31, 2021 20:45 FXStreet Market News
EUR/USD is trading above 1.17, but off the highs, as markets await President Biden’s critical infrastructure speech. Europe’s covid issues weigh on the euro while ECB’s Lagarde dared markets to test the bank. EZ CPI missed with 1.3%. US ADP NFP also fell short with 517K.
Full Article
EUR/USD Forecast: Looking for a bearish breakout
126777 March 31, 2021 20:40 FXStreet Market News
EUR/USD Current Price: 1.1727
- The focus is on US President Joe Biden’s announcement on spending.
- US ADP survey came in at 517K, missing expectations but well above the previous one.
- EUR/USD is still under strong selling pressure and poised to extend its decline.
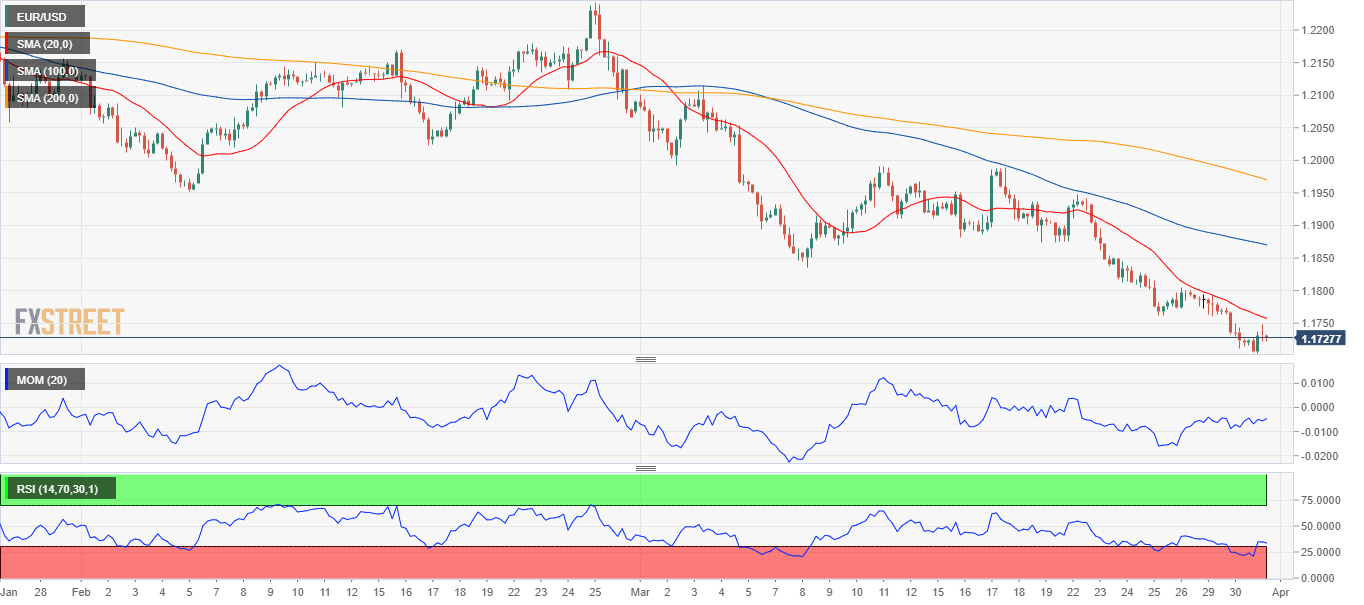
The EUR/USD pair bounced from a fresh 2021 low of 1.1703, as demand for the greenback paused ahead of US President Joe Biden’s speech. The pair peaked at 1.1747 following comments from the European Central Bank President Christine Lagarde, who said that short-term economic moves wouldn’t guide policymakers. “The market can test us as much as they want,” she said, adding that the central bank will adjust its monetary policy as needed depending on financial conditions.
However, the pair was unable to extend its advance and slowly grinds lower ahead of Wall Street’s opening, helped by the ruling cautious mood. The US has just published the March ADP survey on private jobs creation, which resulted at 517K below the 550K expected but much better than the previous 176K. The focus remains on President Biden, expected to announce an up to $ 3 trillion spending program.
EUR/USD short-term technical outlook
The EUR/USD pair has corrected oversold conditions and is poised to extend its decline. The 4-hour chart shows that sellers keep appearing on approaches to a bearish 20 SMA, which heads firmly lower below the longer ones. Technical indicators have resumed their declines within negative levels, in line with another leg south.
Support levels: 1.1705 1.1665 1.1620
Resistance levels: 1.1770 1.1810 1.1850
View Live Chart for the EUR/USD
Full Article
Canada Gross Domestic Product (MoM) came in at 0.7%, above expectations (0.5%) in January
126776 March 31, 2021 20:40 FXStreet Market News
EUR/USD is trading above 1.17, but off the highs, as markets await President Biden’s critical infrastructure speech. Europe’s covid issues weigh on the euro while ECB’s Lagarde dared markets to test the bank. EZ CPI missed with 1.3%. US ADP NFP also fell short with 517K.
Full Article
Canada GDP for January 0.7% vs. 0.5% estimate
126775 March 31, 2021 20:35 Forexlive Latest News Market News
HIGH RISK WARNING: Foreign exchange trading carries a high level of risk that may not be suitable for all investors. Leverage creates additional risk and loss exposure. Before you decide to trade foreign exchange, carefully consider your investment objectives, experience level, and risk tolerance. You could lose some or all of your initial investment; do not invest money that you cannot afford to lose. Educate yourself on the risks associated with foreign exchange trading, and seek advice from an independent financial or tax advisor if you have any questions.
ADVISORY WARNING: FOREXLIVE™ provides references and links to selected blogs and other sources of economic and market information as an educational service to its clients and prospects and does not endorse the opinions or recommendations of the blogs or other sources of information. Clients and prospects are advised to carefully consider the opinions and analysis offered in the blogs or other information sources in the context of the client or prospect’s individual analysis and decision making. None of the blogs or other sources of information is to be considered as constituting a track record. Past performance is no guarantee of future results and FOREXLIVE™ specifically advises clients and prospects to carefully review all claims and representations made by advisors, bloggers, money managers and system vendors before investing any funds or opening an account with any Forex dealer. Any news, opinions, research, data, or other information contained within this website is provided as general market commentary and does not constitute investment or trading advice. FOREXLIVE™ expressly disclaims any liability for any lost principal or profits without limitation which may arise directly or indirectly from the use of or reliance on such information. As with all such advisory services, past results are never a guarantee of future results.
Full Article
Canada: Real GDP expands by 0.7% in January vs. 0.5% expected
126774 March 31, 2021 20:35 FXStreet Market News
- Canadian economy grew at a stronger pace than expected in January.
- USD/CAD trades with modest losses near 1.2600 after the data.
Canada’s Real Gross Domestic Product (GDP) expanded by 0.7% in January, the data published by Statistics Canada showed on Wednesday. This reading followed December’s growth of 0.1% and came in better than the market expectation of 0.5%.
“This ninth consecutive monthly increase continued to offset the steepest drops on record in Canadian economic activity observed in March and April 2020,” the publication read. “However, total economic activity was about 3% below the February level before the COVID-19 pandemic.”
Market reaction
The USD/CAD pair edged modestly lower with the initial reaction and was last seen losing 0.27% on a daily basis at 1.2598.
Full Article