Articles

USD/JPY rises to daily highs above 110.70 on renewed USD strength
150675 June 30, 2021 21:17 FXStreet Market News
- USD/JPY started to edge higher in the early American session.
- US Dollar Index climbs into the positive territory near 92.20.
- 10-year US Treasury bond yield stays in the negative territory.
After spending the majority of the day in a very tight range near 110.50, the USD/JPY pair gained traction in the early American session and reached a daily high of 110.71. As of writing, the pair was up 0.17% on the day at 110.68.
DXY pushes higher after ADP data
Renewed USD strength seems to be helping USD/JPY edge higher. The US Dollar Index (DXY), which managed to post modest gains in the first two days of the week, is currently trading at a nine-day high of 92.19.
The monthly data published by the Automatic Data Processing (ADP) Research Institute showed on Wednesday that employment in the US private sector rose by 692,000 in June. This print came in stronger than the market expectation of 600,000 and helped the USD find demand.
On the other hand, the benchmark 10-year US Treasury bond yield is down 0.7% on the last day of the second quarter, making it difficult for USD/JPY to gather further bullish momentum.
There won’t be any other high-tier data releases in the remainder of the day and quarter-end flows could ramp up market volatility toward the end of the European session.
On Thursday, the Tankan Large Manufacturing Index and the Non-manufacturing Index from Japan will be looked upon for fresh impetus.
Technical levels to watch for
Full Article
Silver Price Analysis: XAG/USD clings to modest gains, upside seems limited
150674 June 30, 2021 21:09 FXStreet Market News
- Silver edged higher on Wednesday and move away from two-and-half-month lows.
- The set-up still favours bearish traders and supports prospects for additional losses.
- A sustained move beyond the $26.20-30 hurdle is needed to negate the bearish bias.
Silver gained some positive traction on Wednesday and built on the overnight bounce from the vicinity of mid-$25.00s, or two-and-half-month lows. The uptick, however, lacked any bullish conviction and the commodity, so far, remained capped below the $26.00 round-figure mark.
The XAG/USD, so far, has been showing some resilience below an important confluence region comprising of the very important 200-day SMA and the 61.8% Fibonacci level of the $23.78-$28.75 move up. The mentioned support is pegged near the $25.70-65 region and is closely followed by the overnight swing lows, which if broken will set the stage for a further depreciating move.
Meanwhile, the commodity’s inability to capitalize on the attempted recovery move favours bearish traders. The negative outlook is reinforced by the fact that oscillators on the daily chart are holding deep in the bearish territory. Hence, any further move up might be seen as a selling opportunity and runs the risk of fizzling out quickly near the $26.20-30 supply zone.
From current levels, the $25.55-50 region might continue to protect the immediate downside. Sustained weakness below should pave the way for a fall towards the key $25.00 psychological mark. Some follow-through selling below the $24.80 region would turn the XAG/USD vulnerable to extend the slide towards the $24.00 mark en-route YTD lows, around the $23.80-75 area touched in March.
Conversely, a sustained strength beyond the $26.20-30 strong barrier will negate the bearish outlook and prompt some short-covering move. The XAG/USD might then accelerate the positive move towards the $26.55-60 hurdle before eventually climbing to the $26.85 region, or the 38.2% Fibo. level This is closely followed by the $27.00 mark, above which the next relevant hurdle is pegged near the 23.6% Fibo. level, around mid-$27.00s.
Silver daily chart
-637606550030795128.png)
Technical levels to watch
Full Article
Chile Unemployment rate: 10% (May) vs previous 10.2%
150673 June 30, 2021 21:09 FXStreet Market News
Information on these pages contains forward-looking statements that involve risks and uncertainties. Markets and instruments profiled on this page are for informational purposes only and should not in any way come across as a recommendation to buy or sell in these assets. You should do your own thorough research before making any investment decisions. FXStreet does not in any way guarantee that this information is free from mistakes, errors, or material misstatements. It also does not guarantee that this information is of a timely nature. Investing in Open Markets involves a great deal of risk, including the loss of all or a portion of your investment, as well as emotional distress. All risks, losses and costs associated with investing, including total loss of principal, are your responsibility. The views and opinions expressed in this article are those of the authors and do not necessarily reflect the official policy or position of FXStreet nor its advertisers. The author will not be held responsible for information that is found at the end of links posted on this page.
If not otherwise explicitly mentioned in the body of the article, at the time of writing, the author has no position in any stock mentioned in this article and no business relationship with any company mentioned. The author has not received compensation for writing this article, other than from FXStreet.
FXStreet and the author do not provide personalized recommendations. The author makes no representations as to the accuracy, completeness, or suitability of this information. FXStreet and the author will not be liable for any errors, omissions or any losses, injuries or damages arising from this information and its display or use. Errors and omissions excepted.
The author and FXStreet are not registered investment advisors and nothing in this article is intended to be investment advice.
Chile Industrial Production (YoY) down to 3.5% in May from previous 5.1%
150672 June 30, 2021 21:05 FXStreet Market News
Information on these pages contains forward-looking statements that involve risks and uncertainties. Markets and instruments profiled on this page are for informational purposes only and should not in any way come across as a recommendation to buy or sell in these assets. You should do your own thorough research before making any investment decisions. FXStreet does not in any way guarantee that this information is free from mistakes, errors, or material misstatements. It also does not guarantee that this information is of a timely nature. Investing in Open Markets involves a great deal of risk, including the loss of all or a portion of your investment, as well as emotional distress. All risks, losses and costs associated with investing, including total loss of principal, are your responsibility. The views and opinions expressed in this article are those of the authors and do not necessarily reflect the official policy or position of FXStreet nor its advertisers. The author will not be held responsible for information that is found at the end of links posted on this page.
If not otherwise explicitly mentioned in the body of the article, at the time of writing, the author has no position in any stock mentioned in this article and no business relationship with any company mentioned. The author has not received compensation for writing this article, other than from FXStreet.
FXStreet and the author do not provide personalized recommendations. The author makes no representations as to the accuracy, completeness, or suitability of this information. FXStreet and the author will not be liable for any errors, omissions or any losses, injuries or damages arising from this information and its display or use. Errors and omissions excepted.
The author and FXStreet are not registered investment advisors and nothing in this article is intended to be investment advice.
EUR/JPY reverses the downside, clings to gains near 131.50
150671 June 30, 2021 21:02 FXStreet Market News
- EUR/JPY’s weekly leg lower met support near 131.30.
- EMU flash CPI came in at 1.9% YoY, Core CPI rose 0.9% YoY.
- US ADP report surprised to the upside at 692K jobs in June.
EUR/JPY navigates a narrow range around 131.50 in tandem with the broad-based consolidative mood in the rest of the global assets.
EUR/JPY faces interim support near 130.80
EUR/JPY struggles for direction following four consecutive daily pullbacks, always amidst the better mood in the greenback, steady US yields and the offered note in the Japanese yen.
On the latter, the US dollar gains extra ground vs. its Japanese peer after the ADP report came in above estimates, showing the US private sector created nearly 700K jobs during last month. The print also reinforces the optimism ahead of Friday’s publication of the Nonfarm Payrolls.
However, the negative price action surrounding the single currency tempers any upside potential for the time being, leaving the cross floating in the lower bound of the weekly range.
Earlier in Euroland, advanced inflation figures noted the upside pressure in consumer prices eased a tad vs. the previous print, as the headline CPI rose 1.9% on a year to June and 0.9% when excluding energy and food costs.
EUR/JPY relevant levels
So far, the cross is advancing 0.01% at 131.41 and a surpass of 132.34 (50-day SMA) would aim for 132.69 (weekly high Jun.23) and finally 133.00 (round level). On the other hand, the next support aligns at 131.27 (weekly low Jun.30) followed by 130.80 (100-day SMA) and then 130.04 (monthly low Jun.21).
Full Article
US dollar gets a lift as the quarter winds down
150669 June 30, 2021 20:56 Forexlive Latest News Market News
Some USD flows hitting the market
The US dollar is near the best levels of the day on most fronts as June winds down. There has been a persistent dollar bid this week that doesn’t line up with other markets — stocks and bonds have been bid.
I suspect that will unwind at the tail end of the week but only if the non-farm payrolls report allows it.
For now, we’ll just have to roll with the flows. Pending home sales are coming up at 10 am ET but the main event is probably the 11 am ET London fix. If fireworks are coming, that will be the time. If we get a further USD pop — particularly against the commodity currencies — I think it will be the right time to fade it.
AUD/USD:
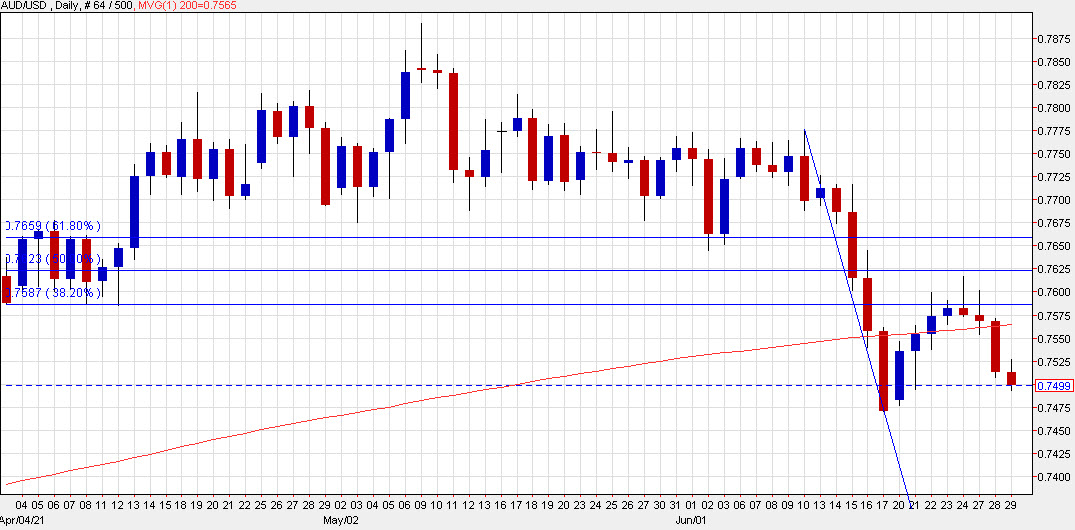
Full Article
Canada Raw Material Price Index increased to 3.2% in May from previous 1%
150668 June 30, 2021 20:40 FXStreet Market News
Information on these pages contains forward-looking statements that involve risks and uncertainties. Markets and instruments profiled on this page are for informational purposes only and should not in any way come across as a recommendation to buy or sell in these assets. You should do your own thorough research before making any investment decisions. FXStreet does not in any way guarantee that this information is free from mistakes, errors, or material misstatements. It also does not guarantee that this information is of a timely nature. Investing in Open Markets involves a great deal of risk, including the loss of all or a portion of your investment, as well as emotional distress. All risks, losses and costs associated with investing, including total loss of principal, are your responsibility. The views and opinions expressed in this article are those of the authors and do not necessarily reflect the official policy or position of FXStreet nor its advertisers. The author will not be held responsible for information that is found at the end of links posted on this page.
If not otherwise explicitly mentioned in the body of the article, at the time of writing, the author has no position in any stock mentioned in this article and no business relationship with any company mentioned. The author has not received compensation for writing this article, other than from FXStreet.
FXStreet and the author do not provide personalized recommendations. The author makes no representations as to the accuracy, completeness, or suitability of this information. FXStreet and the author will not be liable for any errors, omissions or any losses, injuries or damages arising from this information and its display or use. Errors and omissions excepted.
The author and FXStreet are not registered investment advisors and nothing in this article is intended to be investment advice.
Canada Gross Domestic Product (MoM) came in at -0.3%, above forecasts (-0.8%) in April
150667 June 30, 2021 20:40 FXStreet Market News
Information on these pages contains forward-looking statements that involve risks and uncertainties. Markets and instruments profiled on this page are for informational purposes only and should not in any way come across as a recommendation to buy or sell in these assets. You should do your own thorough research before making any investment decisions. FXStreet does not in any way guarantee that this information is free from mistakes, errors, or material misstatements. It also does not guarantee that this information is of a timely nature. Investing in Open Markets involves a great deal of risk, including the loss of all or a portion of your investment, as well as emotional distress. All risks, losses and costs associated with investing, including total loss of principal, are your responsibility. The views and opinions expressed in this article are those of the authors and do not necessarily reflect the official policy or position of FXStreet nor its advertisers. The author will not be held responsible for information that is found at the end of links posted on this page.
If not otherwise explicitly mentioned in the body of the article, at the time of writing, the author has no position in any stock mentioned in this article and no business relationship with any company mentioned. The author has not received compensation for writing this article, other than from FXStreet.
FXStreet and the author do not provide personalized recommendations. The author makes no representations as to the accuracy, completeness, or suitability of this information. FXStreet and the author will not be liable for any errors, omissions or any losses, injuries or damages arising from this information and its display or use. Errors and omissions excepted.
The author and FXStreet are not registered investment advisors and nothing in this article is intended to be investment advice.
Canada April GDP -0.3% m/m vs -0.8% expected
150665 June 30, 2021 20:35 Forexlive Latest News Market News
Canada April GDP data

- April prelim estimate from Statistics Canada was -0.8% m/m
- First decline in 12 months
- Prior was +1.1%
- Q1 GDP was +5.6% annualized
- Q2 GDP was 9.6% annualized
- May prelim GDP -0.3%
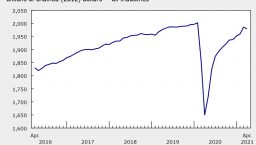
Total Canadian economic activity is about 1% below Feb 2020, when the pandemic began.
Full Article
Canada: Real GDP contracts by 0.3% in April vs. -0.8% expected
150664 June 30, 2021 20:35 FXStreet Market News
- Canadian economy contracted at a softer pace than expected in April.
- USD/CAD remains in the negative territory below 1.2400.
Canada’s Real Gross Domestic Product (GDP) contracted at a monthly rate of 0.3% in April, the data published by Statistics Canada showed on Wednesday. This reading came in slightly better than the market expectation for a decrease of 0.8%. In March, the Canadian economy grew by 1.3% (revised from 1.1%.
“Overall, 12 of 20 industrial sectors were down as gains in goods-producing industries (+0.5%) were more than offset by contractions in services-producing industries (-0.6%),” the publication read. “Preliminary information indicates a decrease in real GDP of approximately 0.3% in May.”
Market reaction
The USD/CAD pair dropped to a session low of 1.2366 but didn’t have a difficult time staging a rebound. As of writing, the pair was down 0.1% on the day at 1.2388.
Full Article
Canada Industrial Product Price (MoM) increased to 2.7% in May from previous 1.6%
150663 June 30, 2021 20:35 FXStreet Market News
Information on these pages contains forward-looking statements that involve risks and uncertainties. Markets and instruments profiled on this page are for informational purposes only and should not in any way come across as a recommendation to buy or sell in these assets. You should do your own thorough research before making any investment decisions. FXStreet does not in any way guarantee that this information is free from mistakes, errors, or material misstatements. It also does not guarantee that this information is of a timely nature. Investing in Open Markets involves a great deal of risk, including the loss of all or a portion of your investment, as well as emotional distress. All risks, losses and costs associated with investing, including total loss of principal, are your responsibility. The views and opinions expressed in this article are those of the authors and do not necessarily reflect the official policy or position of FXStreet nor its advertisers. The author will not be held responsible for information that is found at the end of links posted on this page.
If not otherwise explicitly mentioned in the body of the article, at the time of writing, the author has no position in any stock mentioned in this article and no business relationship with any company mentioned. The author has not received compensation for writing this article, other than from FXStreet.
FXStreet and the author do not provide personalized recommendations. The author makes no representations as to the accuracy, completeness, or suitability of this information. FXStreet and the author will not be liable for any errors, omissions or any losses, injuries or damages arising from this information and its display or use. Errors and omissions excepted.
The author and FXStreet are not registered investment advisors and nothing in this article is intended to be investment advice.
Canada producer price is for May 2.7% versus 1.6% last month
150662 June 30, 2021 20:33 Forexlive Latest News Market News
HIGH RISK WARNING: Foreign exchange trading carries a high level of risk that may not be suitable for all investors. Leverage creates additional risk and loss exposure. Before you decide to trade foreign exchange, carefully consider your investment objectives, experience level, and risk tolerance. You could lose some or all of your initial investment; do not invest money that you cannot afford to lose. Educate yourself on the risks associated with foreign exchange trading, and seek advice from an independent financial or tax advisor if you have any questions.
ADVISORY WARNING: FOREXLIVE™ provides references and links to selected blogs and other sources of economic and market information as an educational service to its clients and prospects and does not endorse the opinions or recommendations of the blogs or other sources of information. Clients and prospects are advised to carefully consider the opinions and analysis offered in the blogs or other information sources in the context of the client or prospect’s individual analysis and decision making. None of the blogs or other sources of information is to be considered as constituting a track record. Past performance is no guarantee of future results and FOREXLIVE™ specifically advises clients and prospects to carefully review all claims and representations made by advisors, bloggers, money managers and system vendors before investing any funds or opening an account with any Forex dealer. Any news, opinions, research, data, or other information contained within this website is provided as general market commentary and does not constitute investment or trading advice. FOREXLIVE™ expressly disclaims any liability for any lost principal or profits without limitation which may arise directly or indirectly from the use of or reliance on such information. As with all such advisory services, past results are never a guarantee of future results.
Full Article