Articles
Eurozone: Inflation and ECB meeting minutes – Danske Bank
24952 March 30, 2019 03:33 FXStreet Market News
Next week, the calendar shows among the most relevant events, inflation data and the European Central Bank minutes. Analysts from Danske Bank expect March core inflation stayed at 1.0% as the Easter effect will exert downward pressure on service price inflation.
Key Quotes:
“In the euro area, we await the preliminary March HICP inflation numbers on Monday. In February, headline inflation came in at 1.5% y/y, while core inflation fell to 1.0% y/y. Despite a strong pickup in wages, core inflation has fluctuated around this level for the last one and a half years. Although we still expect core inflation to climb higher in 2019, we foresee the March core inflation print staying at 1.0% y/y, as the Easter effect will exert downward pressure on service price inflation, which might be even more pronounced following the methodological changes to German package tours. For headline inflation we see scope for a rise to 1.7% y/y, driven by increasing energy prices.
“On Thursday, we get minutes from the March ECB meeting. At the latest meeting the ECB announced a new series of TLTRO3, opened the door for further easing, and extended the forward guidance to rates remaining at present levels ‘at least through the end of the 2019’. We are particularly interested in the details of the discussion of the TLTRO3 announcement from members of the Governing Councils.”
“Judging from recent communication, the ECB has become increasingly concerned about the side effects of a prolonged period of negative rates on bank profitability. However, we do not expect a discussion on a tiered deposit system to already have taken place.”
[STOPOUT] W1 Sell Silver
24947 March 30, 2019 03:19 SwingFish Forex Signals SILVER

W1 Dell SILVER (XAGUSD)
Sell NOW 15.246
Stop: 15.675
TP1: 13.954 TP2: 13.461
Daily Chart Reference

WH Econ Advisor Kudlow: Fed should ‘immediately’ cut rates
24946 March 30, 2019 03:03 FXStreet Market News
In an interview with CNBC, White House economic advisor Larry Kudlow argued that the Fed should ‘immediately’ cut rates.
Key quotes (via Reuters)
- Trump would like Fed to stop shrinking balance sheet.
- There is no economic emergency, just presenting point of view on Fed policy.
- White House thinks Fed went too far with rate hikes.
- Our view is that at some point I wouldn’t mind seeing the Fed drop their target rate.
- I don’t think the underlying economy is slowing.
- Many people surprised by low inflation rate.
Oil Technical Analysis: The WTI bull trend is intact
24945 March 30, 2019 02:53 FXStreet Market News
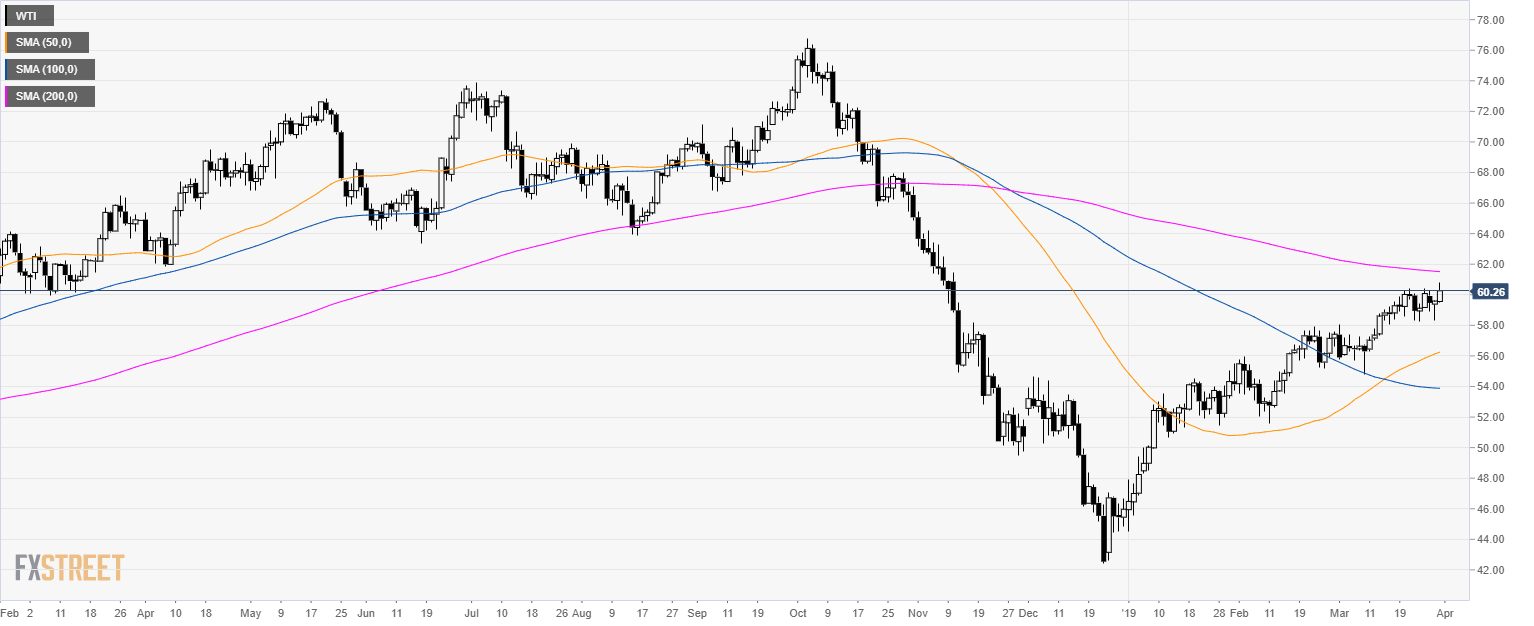
Oil daily chart
- Oil is trading above the 50 and 100-day simple moving averages (SMAs) suggesting a bullish bias.
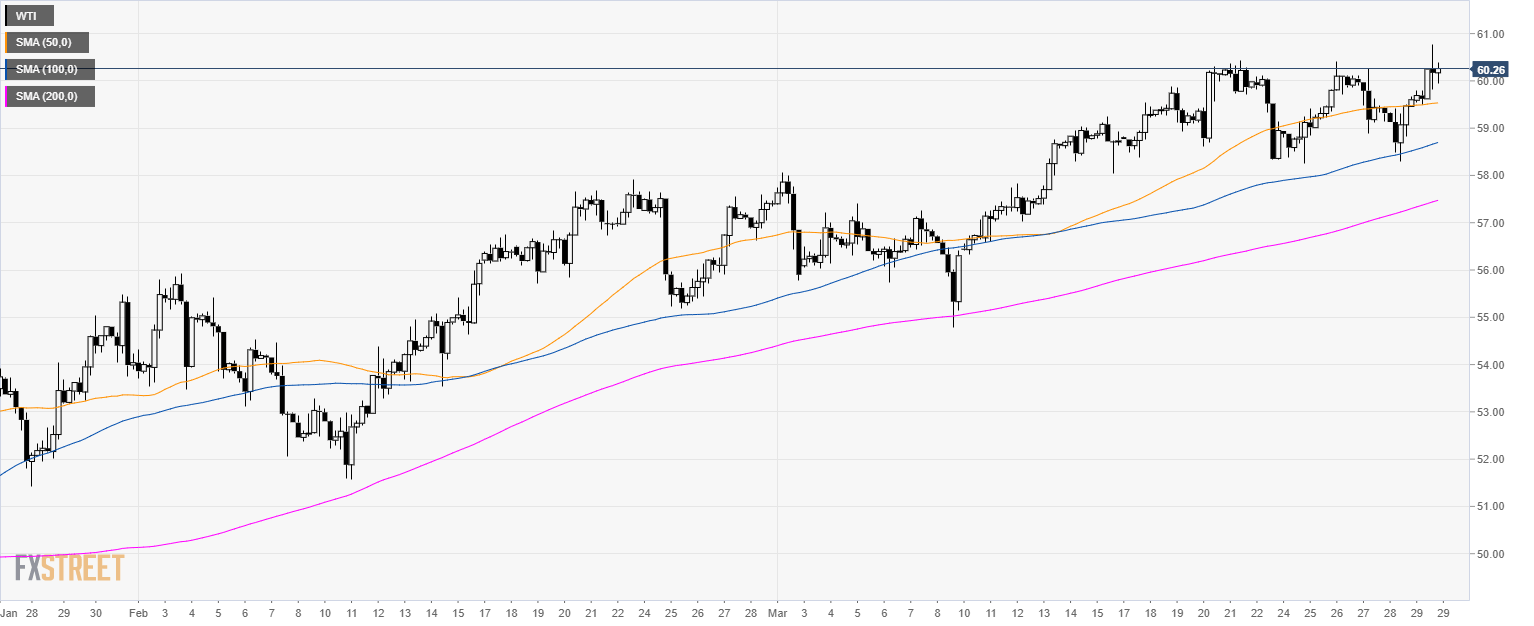
Oil 4-hour chart
- Crude oil WTI is trading above its main SMAs suggesting a bullish bias in the medium-term.
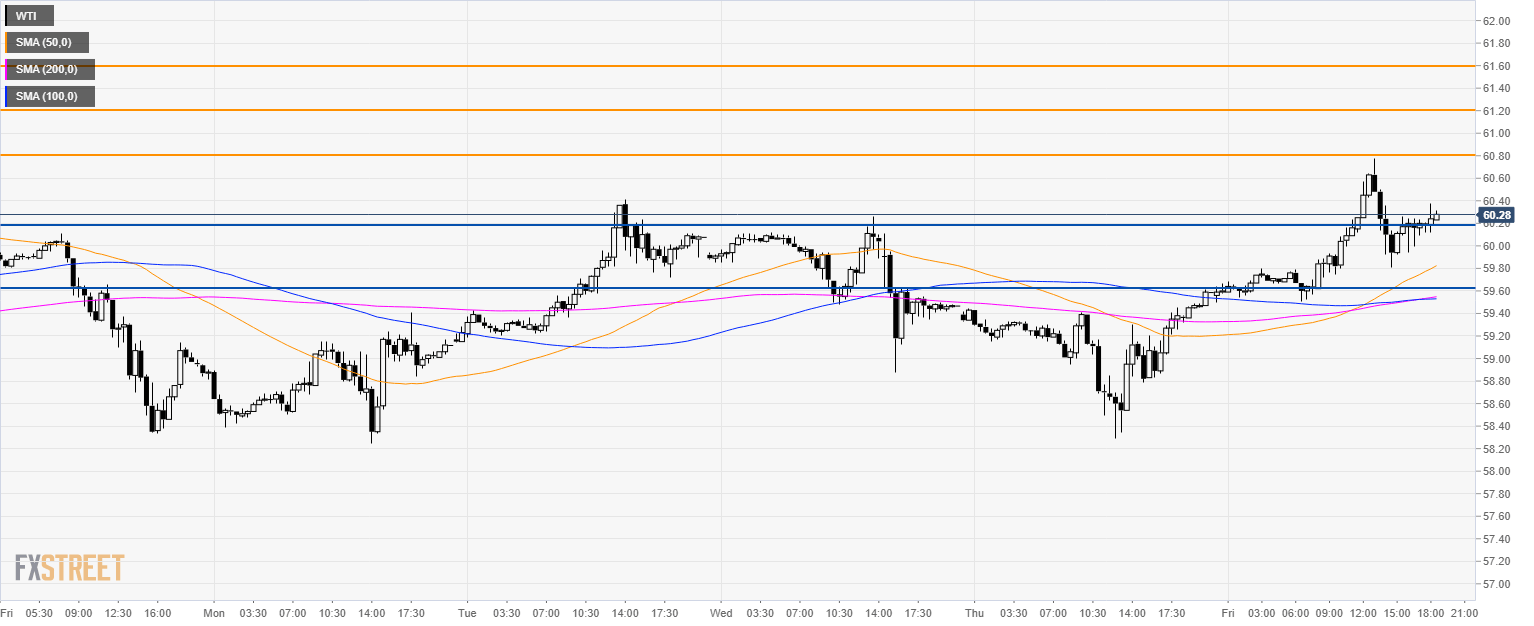
Oil 30-minute chart
- Bulls are looking for a break beyond $60.80 a barrel. The next resistances are seen at 61.20 and 61.60 level.
- Support is at 60.20 and 59.60 level.
Additional key levels
Gold finds resistance near $1300, loses nearly $20 for the week
24944 March 30, 2019 02:33 FXStreet Market News
- 10-year US T-bond yield eases from daily highs.
- Dİsappointing inflation data from the U.S. limits greenback’s gains.
- US Dollar Index looks to close the week above 97.20.
After slumping to its lowest level in three weeks at $1286.66, the XAU/USD pair staged a strong rebound but failed to break above the critical $1300 threshold. With the trading action turning subdued in the last couple of hours, the pair is moving in a tight range near the $1293 handle, adding a little over $3 on a daily basis. Despite today’s recovery, the pair looks to close the week around $20 lower.
The decisive correction witnessed in the US Treasury bond yields in mid-week weighed on the precious metal and triggered a technical selling wave after the pair broke below $1300 and allowed investors to remain in control of the price action.
Although the 10-year T-bond yield rose more than 1% on Friday, it pulled away from its daily highs to help the pair cling to its modest gains. Furthermore, following a positive start to the day boosted by renewed optimism surrounding the U.S.-China trade negotiations, Wall Street struggled to push higher to point out to a neutral sentiment ahead of the weekend.
On the other hand, the US Dollar Index, which advanced to its best level since March 11 at 97.34, lost its traction after the data published by the U.S. Bureau of Economic Analysis showed that the core PCE price index eased to 1.8% on a yearly basis in January and moved further away from the Federal Reserve’s 2% target. At the moment, the DXY is up only 0.04% on a daily basis at 97.25.
Technical levels to consider
With a daily close above $1300 (daily high/psychological level), the pair could target $1310 (50-DMA) and $1319 (Mar. 27 high). On the downside, supports are located at $1286 (daily low), $1280 (Mar. 7 low) and $1276 (Jan. 24 low).
USD/CAD holds near 1.3350 as Loonie consolidates gains
24942 March 30, 2019 02:03 FXStreet Market News
- Canadian dollar: best performer among majors on Friday boosted by economic data and crude oil prices.
- USD/CAD: worst day since February 22.
The USD/CAD pair is about to end the week hovering around 1.3360, posting a daily loss of around 60 pips, the biggest slide since mid-February. The loonie recovered sharply, making a reversal from 3-week lows.
The loonie jumped across the board following the Canadian GDP report that surpassed expectations. The economy expanded 0.3% in January while market consensus pointed to a flat reading. “Outside of energy, growth picked up nicely with GDP excluding oil and gas up 0.5% in the month and 2% over the last year. Overall, today’s data remain consistent with our view that the economy’s soft patch over Q4/18 and Q1/19 will prove transitory”, said Josh Nye, Senior Economist at RBC Economics Research.
Another positive contribution to the loonie on Friday were crude oil prices. The WTI rose above $60.00 to the highest in four months. Regarding the US dollar, it is up versus European currencies and the yen but is falling against commodity and emerging market currencies. Data from the US came in mixed (soft PCE price index and upbeat housing data) not helping the dollar.
Levels to watch
The USD/CAD bottomed at 1.3340, the lowest in a week and then bounced modestly to the upside during the American session. It rose to 1.3372 before losing strength and pulling back to 1.3360, level located below Tuesday’s low. The chart of the current week shows a potential double top at 1.3440. The neckline is seen at 1.3360, so a consolidation below could point to further losses.
EUR/USD Technical Analysis: Single currency under pressure below 1.1250 level
24941 March 30, 2019 01:53 FXStreet Market News
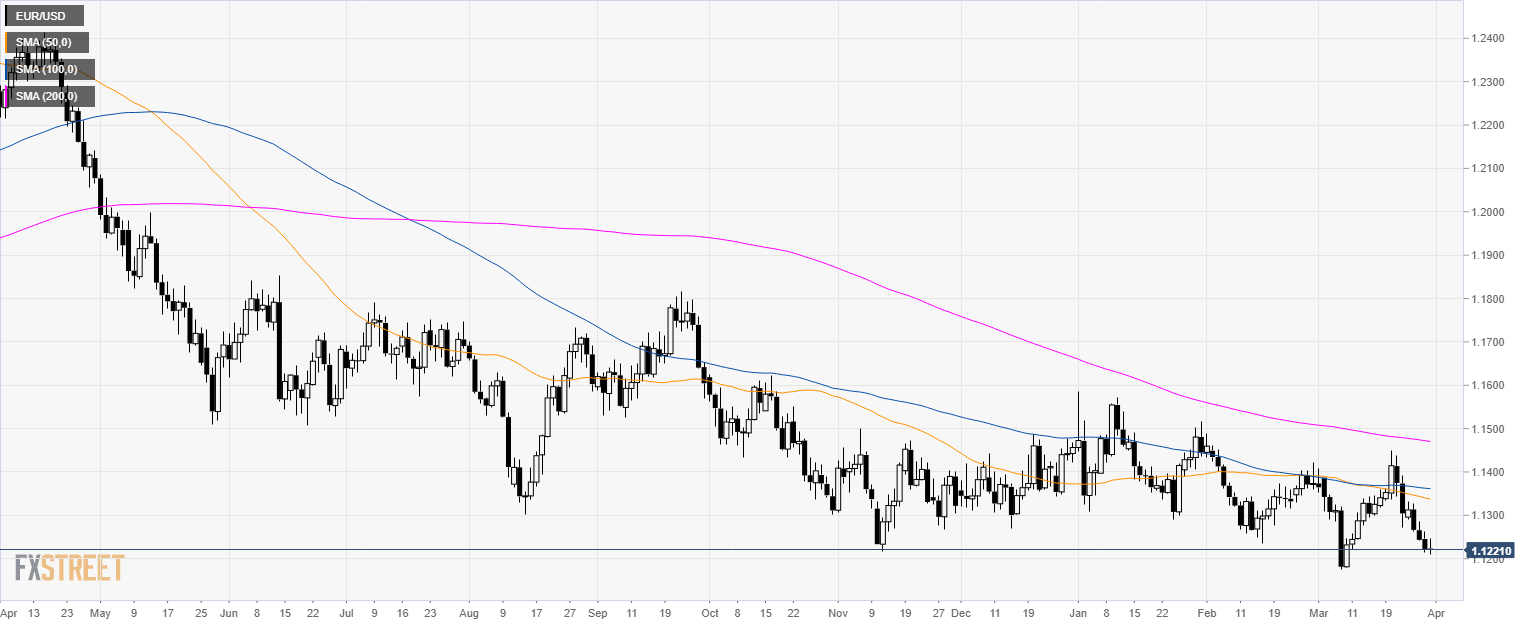
EUR/USD daily chart
- EUR/USD is trading in a bear trend below its 200-day simple moving average (SMA).
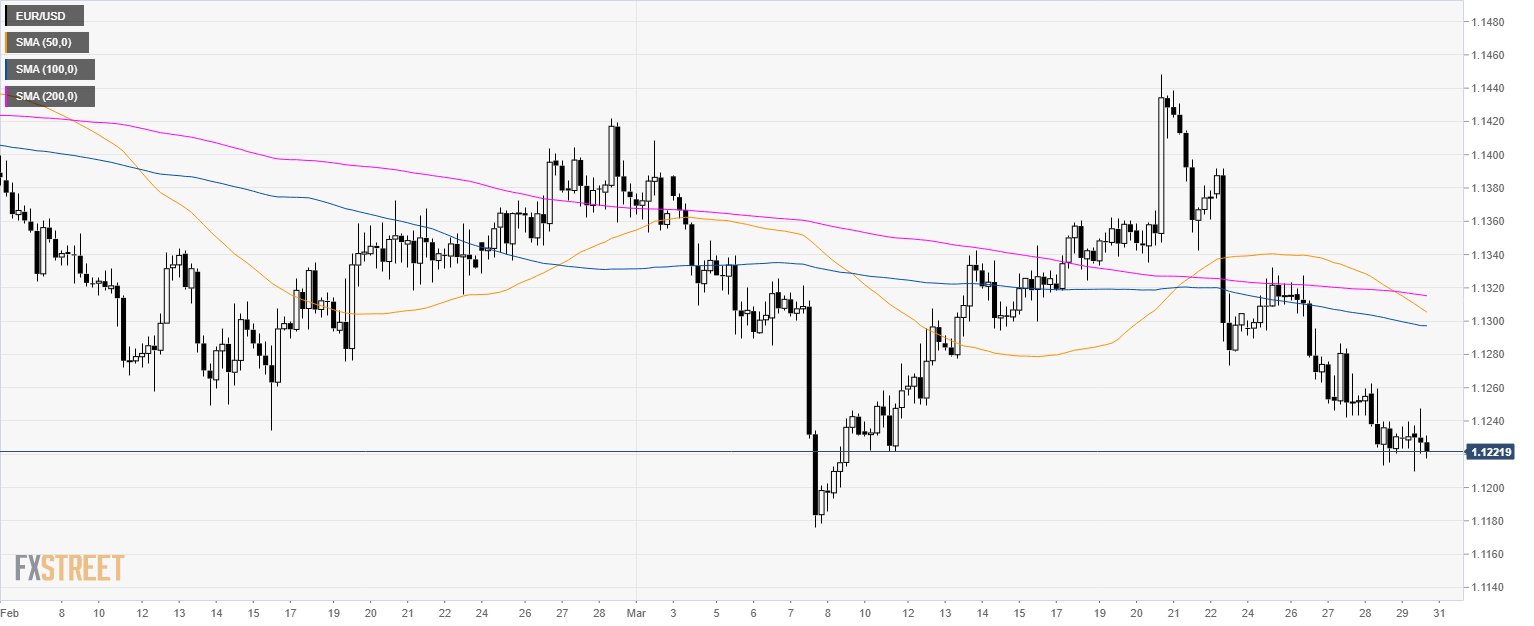
EUR/USD 4-hour chart
- EUR/USD is trading below its 200 SMA suggesting bearish momentum in the medium-term.
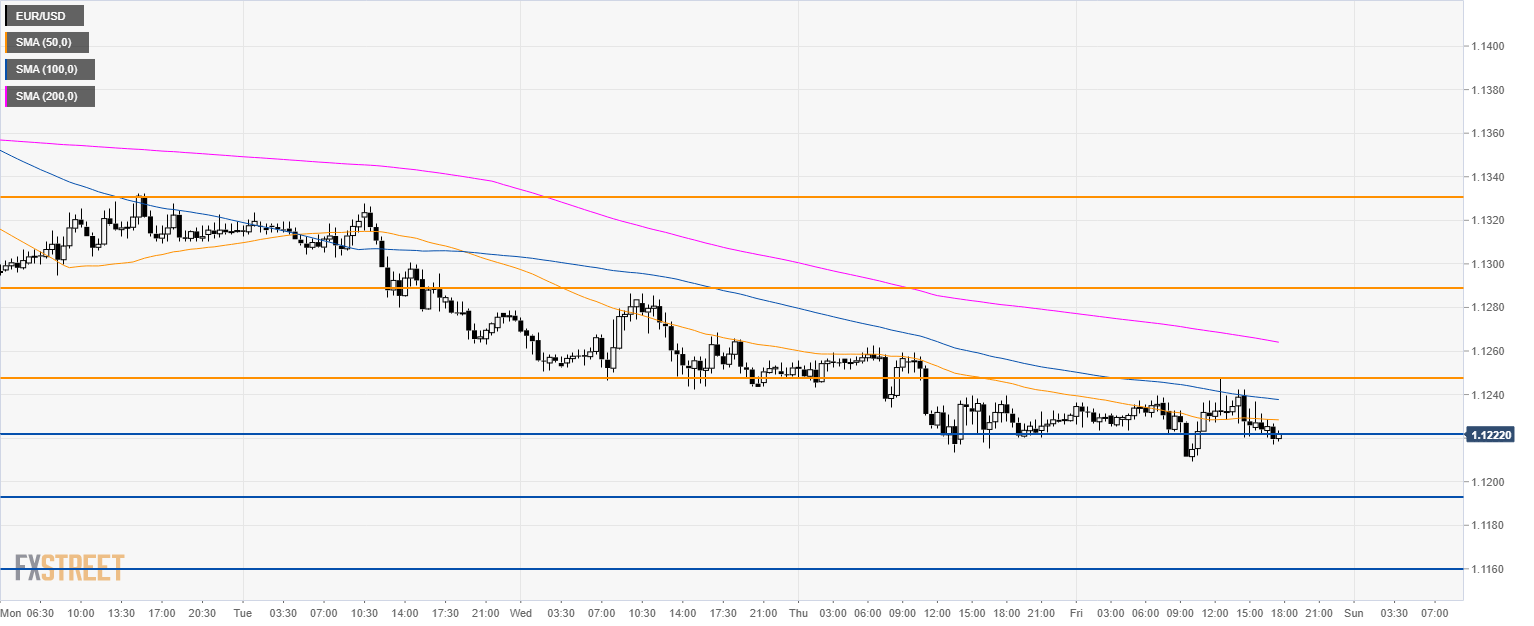
EUR/USD 30-minute chart
- EUR/USD is trading below its main SMAs suggesting bearish momentum in the short-term.
- A breakdown below 1.1220 support should send EUR/USD to 1.1190 and 1.1160 level.
- Immediate resistance is at 1.1250 and 1.1330 level.
Additional key levels
US Personal Income and Spending: More evidence of a soft patch – Wells Fargo
24940 March 30, 2019 01:33 FXStreet Market News
Data released today showed lower than expected numbers in the personal income and spending report. According to analysts at Wells Fargo, we are still in the shadow of the shutdown in terms of data and shows the consumer is losing momentum. They see that tepid inflation data from the report underpins the decision of the Federal Reserve to pause.
Key Quotes:
“Personal income fell 0.1% in January but rebounded 0.2% in February—on balance a soft start to 2019 on the income side. December was a curiously bad month for the consumer. In this report and in the retail sales figures for that month we saw the biggest monthly drops in about a decade. Frankly we still have some doubts about that weakness and expected a bounce in January, but personal spending added just 0.1% in the month.
“The PCE deflator was down 0.1% in January, and even the core measure grew a less-than-expected 0.1%. Both measures indicate sub-2% annual inflation and give the Fed more reason to pause.”
Relative Strength Index: How to Trade Using the RSI Indicator
24939 March 30, 2019 01:03 ICMarkets Market News
Nowadays, popular trading platforms offer in excess of 100 indicators. You could say you are almost spoilt for choice. The mammoth selection, however, tends to be detrimental, often leaving traders overwhelmed, particularly those in the earlier junctures of their journey.
Fortunately, a handful of indicators have stood the test of time.
Including, but certainly not limited to, the Slow Stochastic, The Moving Average Convergence & Divergence (MACD), Moving Averages and the Relative Strength Index (RSI) are well known among the technical community.
For the purpose of this piece, though, focus is drawn towards the RSI.
Getting to know the RSI indicator
Developed by J. Welles Wilder, and presented in his book New Concepts in Technical Trading Systems (1978), the RSI remains a prominent momentum oscillator – momentum is the rate of the rise or fall in price.
The RSI calculates momentum as a ratio of higher price closes over lower closes. For example, markets experiencing more upside momentum naturally have a higher RSI reading.
As is evident from the image below, the indicator is basic in form, oscillating between 0-100. In addition to this, an exponential moving average (EMA) is applied to its canvas, along with high and low levels marked at 70 and 30.

RSI settings
The RSI indicator’s default calculation is 14 periods, the suggested value by Wilder in his book. This means the indicator examines the closing price of 14 candles to create a reading on the timeframe being analysed.
Although 14 is the default, a number of settings are available which typically depends on the trading strategy employed:
- Short-term intraday traders (day trading) may favour lower settings using periods of 9-11.
- Medium-term swing traders tend to adopt the default setting of 14.
- Longer-term position traders normally prefer a higher period, ranging from 20-30.
In terms of the indicator’s calculation, today’s trading platforms are capable of performing the RSI calculation automatically, leaving traders free to focus on what’s important. For those who wish to understand the numbers behind the RSI, nevertheless, here’s a brief look at its calculation:
RSI = average gain in the period / loss in the period.
RSI = 100 – (100 / [1 + RS]).
Average gain is calculated as (previous average gain * (period – 1) + current gain) / period except for the first day which is just an SMA. The average loss is similarly calculated using losses.
The many uses of the RSI indicator
Overbought and Oversold:
Traditionally, an RSI value beyond 70 indicates overbought conditions, whereas an RSI value below 30 suggests oversold conditions.
These two terms are relatively self-explanatory. An overbought level describes consistent upward moves over a period of time and can alert traders to a potentially waning market, or weakening trend. The term oversold, nonetheless, defines consistent downward moves visible over a period of time, and thus reflects a possible trend reversal to the upside is in the offing.
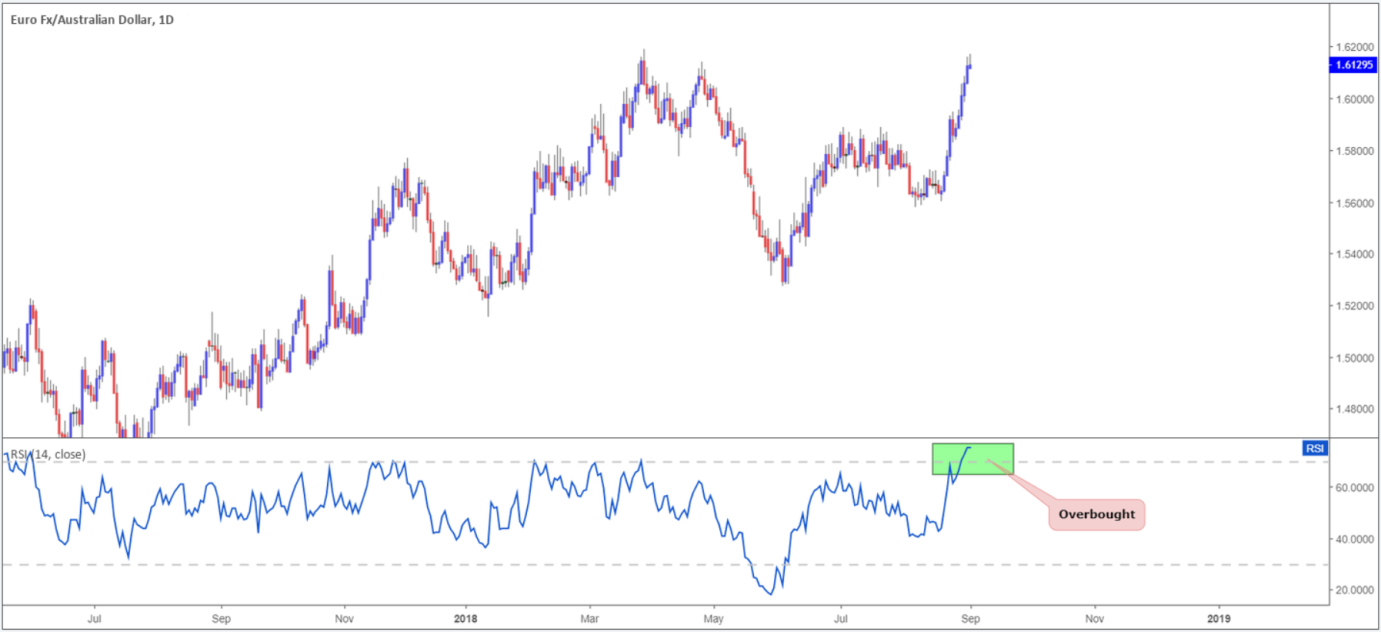
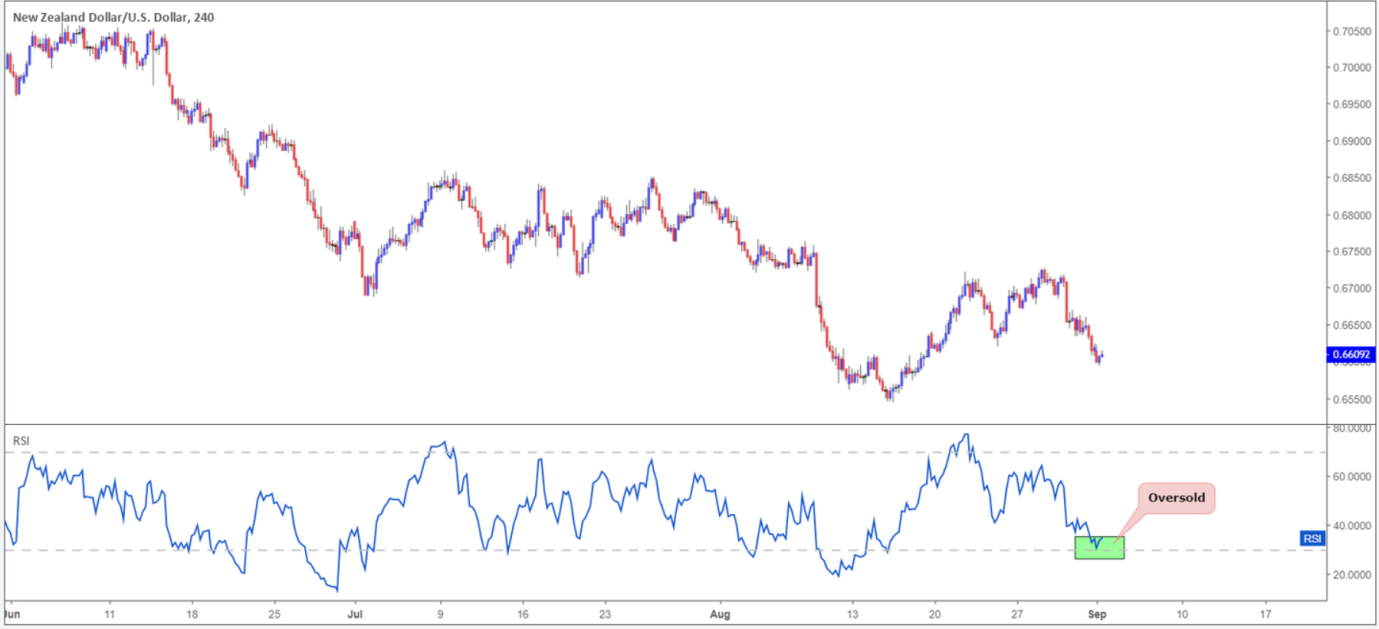
In addition to the above, traders also need to take into account the RSI can remain overbought or oversold for extended periods in trending environments. This is important to recognize as it can lead to numerous false signals. To help tackle this, some traders elect to use more extreme values in the range of 80-20 as an alternative to the traditional 70-30.
Divergence:
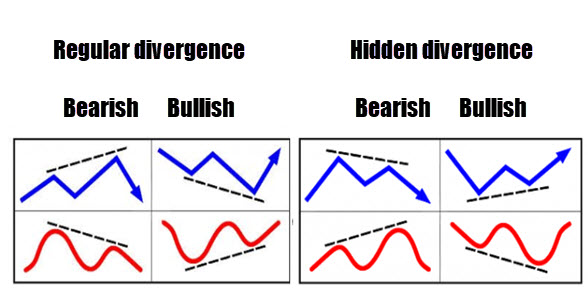
Divergence occurs when underlying price movement (the candlesticks) prints a fresh high/low that is not confirmed by the RSI. To the side are two examples of divergences seen regularly in the market (blue signifies price action and red represents RSI movement).
To help solidify the image, here is an example of regular bearish divergence on a trading chart – the opposite of this is simply a mirror version offering regular bullish divergence:
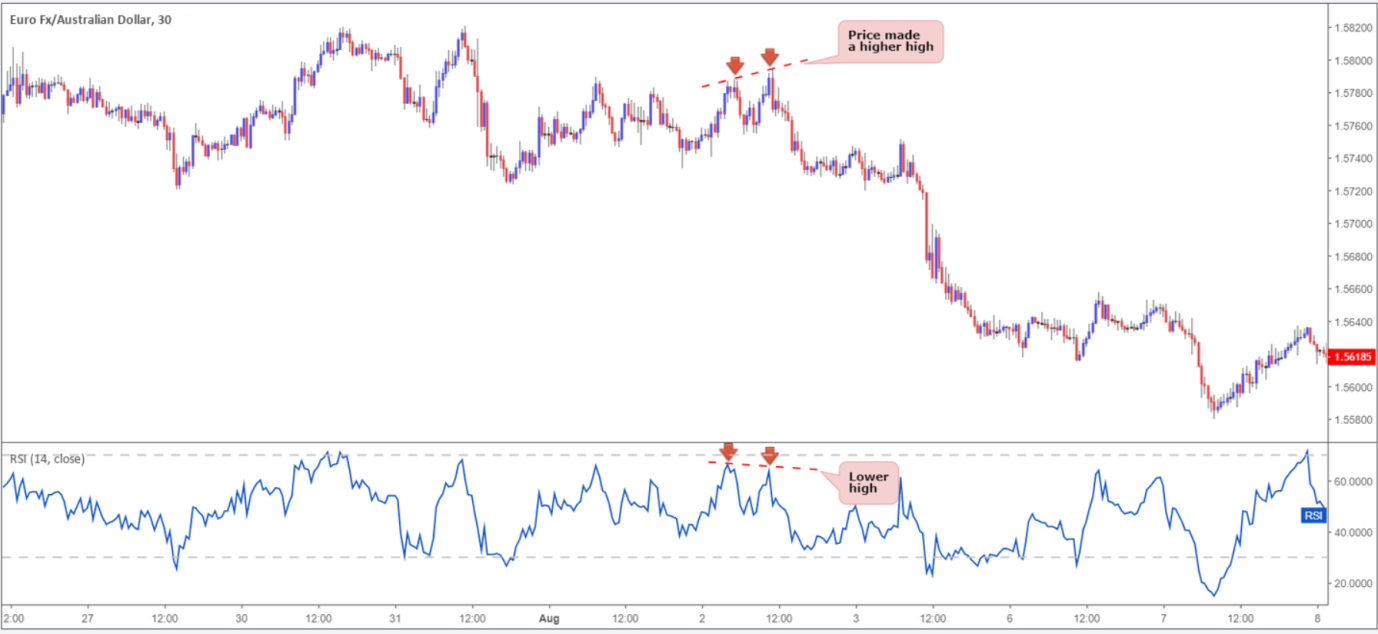
Divergence signals can offer an effective edge on the price chart, enabling traders to spot a potentially weakening/strengthening market.
Divergences are visible across all timeframes. For the best results, however, divergence observed on higher timeframes tends to suggest higher-probability signals.
RSI centre line:
The centre line of most oscillators is often overlooked. Found in the middle of the range at 50, this barrier is in place to discern early shifts in the underlying price trend. A push above 50 portends a strong immediate trend, whereas a move below 50 indicates an immediate bearish trend.
RSI patterns:
The RSI EMA has the ability to formulate patterns that precede price action. Trend lines, support and resistance, double bottoms and tops are just some of the technical formations to keep a watchful eye on.
By way of an example, the EUR/AUD M30 chart shown below was, at the time, compressed within a mild ascending channel pattern, with traders likely expecting its borders to hold.
The large bearish candle (point 1) shows strength to the downside, though price had yet to penetrate the channel support. Yet, on the RSI the indicator pierced beneath trend line support (point 2), providing an early signal price action may continue to press lower and eventually break the price chart’s channel support, which it did. In addition, there was also an opportunity to enter short at point 3 at the retest of the recently broken channel support (now acting resistance), given the RSI was also chalking up a similar retest play around the underside of its trend line support-turned resistance at point 4.
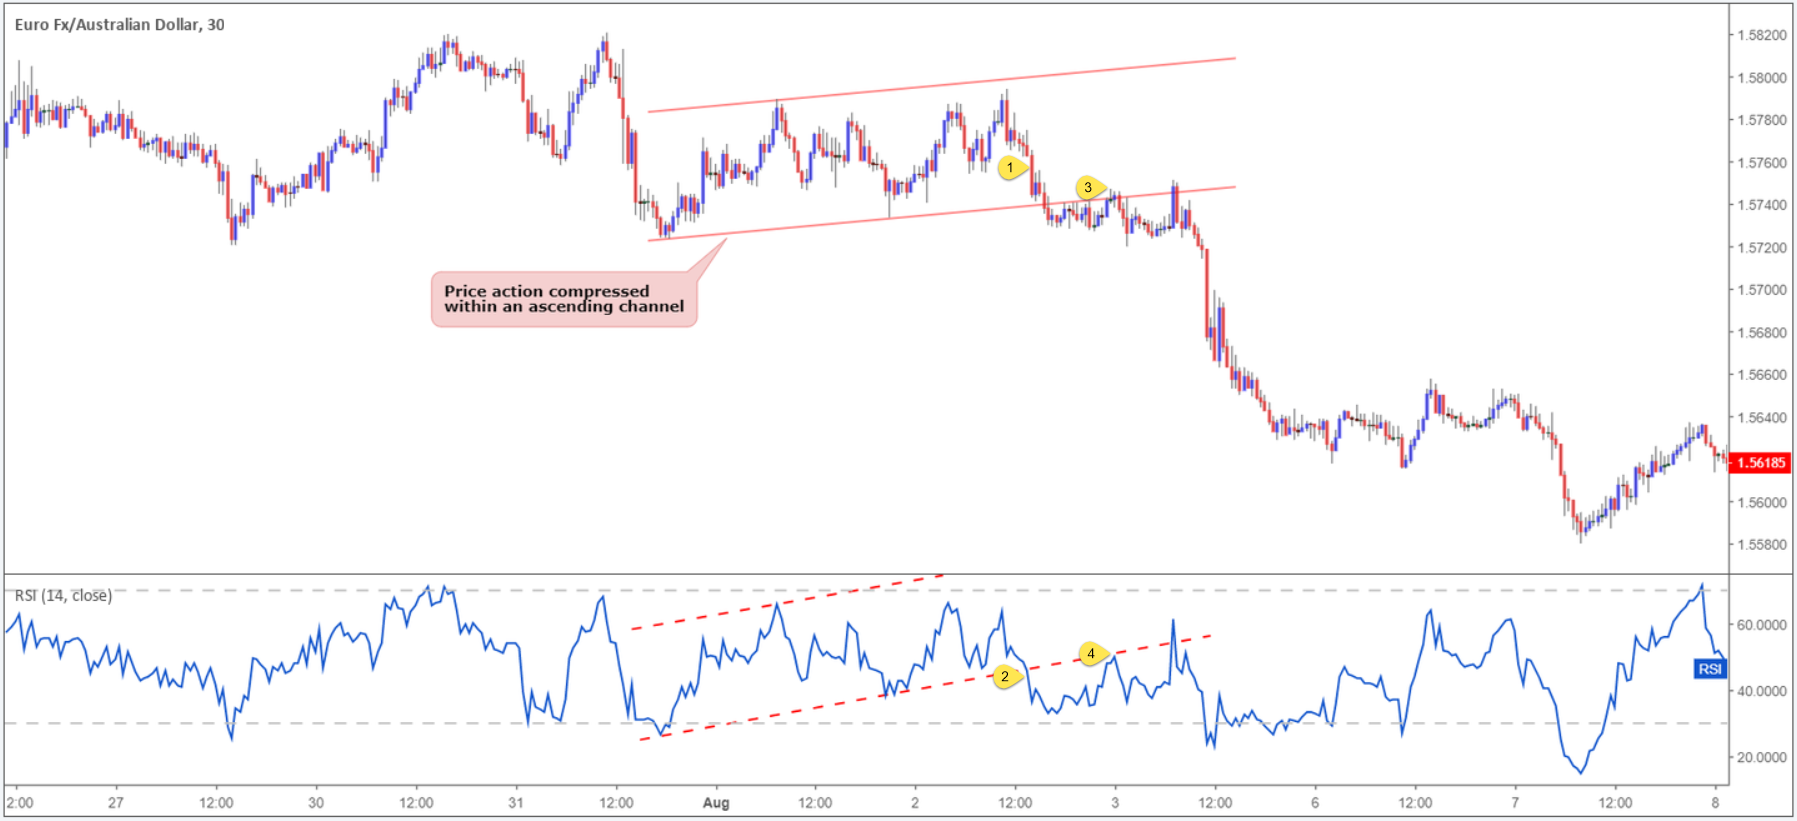
The chart, although reasonably simple, demonstrates the effectiveness of combining a price action pattern with the tools offered through the RSI indicator.
A final point to consider here is there is absolutely no need for the RSI pattern and chart pattern to emulate each other: In other words, the RSI pattern could form a trend line support, while price action trades from a demand zone.
Does the RSI show strength?
It shows a mathematical calculation of strength.
Although the RSI certainly has its place in a technician’s toolbox, trading it in isolation is challenging. If trading could be boiled down to following an indicator’s movement, there’d be a lot more traders that are successful.
Combining the power of the RSI along with additional technical tools such as supply and demand, support and resistance, trend lines or moving averages is certainly a viable option. There are a number of technical indicators that complement RSI movement.
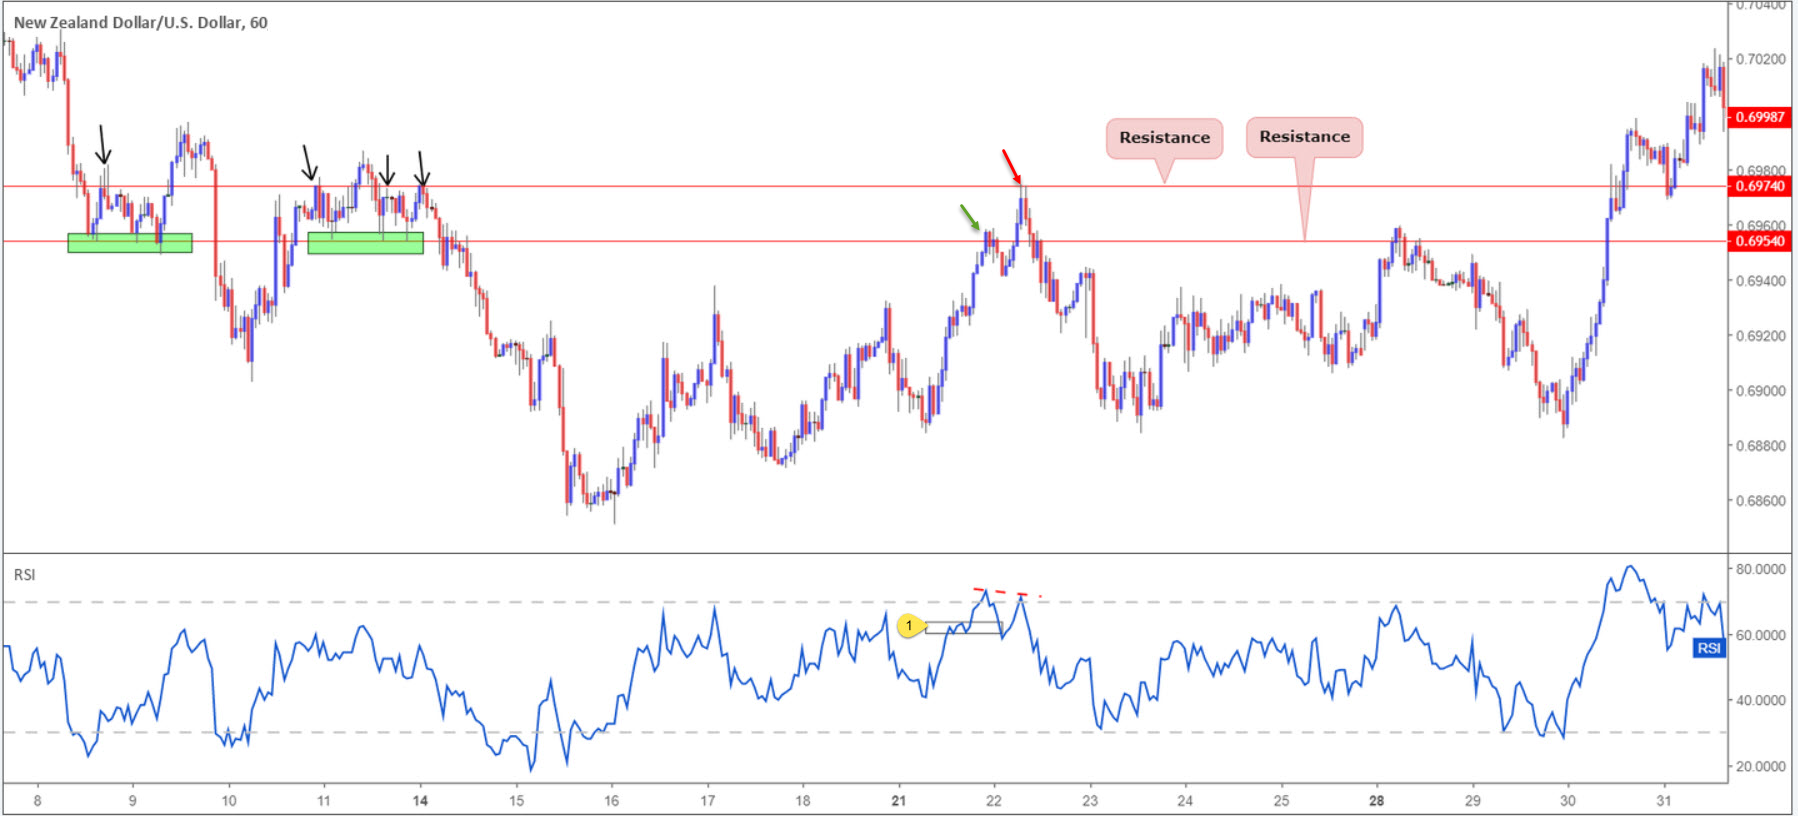
As an example, check out the NZD/USD M30 price chart depicted below. Two resistance levels stand out: 0.6974 and 0.6954 (red/green arrows). Both are of equal weighting as far as resistance levels go, though the upper barrier boasted additional confluence by way of an RSI bearish (regular) divergence signal within overbought territory. What’s more, the RSI engulfed a demand area (point 1) prior to forming the divergence signal. As a result of this, not only did we have a solid resistance level in play on the candles, the RSI exhibited a clear indication this market was likely weakening.
Final thoughts
The best form of technical analysis will always be what suits YOUR trading style and personality.
The RSI momentum indicator, as demonstrated in this article, has a multitude of uses which could benefit your trading.
Feel free to take it for a test drive using our free demo account here: https://www.icmarkets.com/en/open-trading-account/demo.
GBP/USD recovers above 1.30 following the initial sell-off triggered by Brexit vote
24938 March 30, 2019 01:03 FXStreet Market News
- PM May’s Withdrawal deal gets rejected by a majority of 58 on Friday.
- US Dollar Index struggles to push higher after disappointing inflation data.
- UK GDP expands by 0.2% in Q4 as expected.
The GBP/USD pair came under heavy bearish pressure and slumped to its lowest level since March 11 at 1.2976 after the British Parliament voted down British Prime Minister Theresa May’s Withdrawal deal. However, with investors trying to understand what the next steps will be in the Brexit process and taking their profits off the table ahead of the weekend, the pair staged a rebound and was last seen trading at 1.3030, losing 0.1% on a daily basis.
Citing government source familiar with talks, Bloomberg recently reported that PM May was open to changing the Brexit political declaration and ask the EU for another short extension, reviving hopes of PM May trying, once again, to come up with a deal that will be supported by the majority of Parliament. On a similar note, the PM’s spokesman said that it was good to see some senior lawmakers changing their stance and vote for the deal despite the defeat.
Meanwhile, commenting on this development, Irish Prime Minister Leo Varadkar argued that the EU must consider granting a long extension if the UK were to fundamentally change its approach.
Earlier in the day, the UK’s Office for National Statistics reported that the real GDP expanded by 0.2% on a quarterly basis in the fourth quarter as expected and brought the annual growth rate up to 1.4% from 1.3%. Other data from the UK revealed that the total business investment contracted by 2.5% on a yearly basis in Q4 to better the analysts’ estimate of -3.7%. Nevertheless, the data failed to help the sterling gather strength ahead of the Brexit vote.
On the other hand, after today’s data from the U.S. showed that the Fed’s favourite inflation gauge, the annual core PCE price index, edged down to 1.8% in January, the greenback failed to preserve its bullish momentum and the US Dollar Index erased its daily gains to turn flat near 97.20, helping the pair extend its recovery.
Technical outlook by FXStreet analyst Yohay Elam
Cable is approaching the 1.3005 level where it had bounced twice in during March, a double bottom and a significant support line. Break or bounce? This is a critical question.
Losing the line opens the door to 1.2960, another double-bottom and the lowest point in March. Further down, 1.2895 was a support line in February and 1.2830 capped GBP/USD when it traded on lower ground.
1.3080 was a swing high earlier in the day and a swing low also earlier in the month. 1.3140 was a support line twice as well, while 1.3230 held the pair down several times. 1.3270 was the peak of the week.
GBP/USD: Investors to shift to a sell-on-rallies stance as Brexit tensions mount – TDS
24937 March 30, 2019 00:53 FXStreet Market News
“Despite last-minute scrambles to bring MPs over to supporting her deal, May’s Withdrawal Agreement failed yet again in the House of Commons, losing 344 to 286. Key to this loss was that the DUP, hard ERG brexiters, and Labour rebels did not support her deal,” note TD Securities analysts.
Key quotes
“12 April is the new 29 March. But given the lack of progress, an election is looking increasingly likely in our view, and indeed May hinted at this during her address after the result was announced. Both Labour and SNP would support this.”
“FX: GBP remains on its back foot in the aftermath of today’s votes and we expect this to extend – particularly if cable closes the week significantly below 1.30. We think GBP has traded with the benefit of the market’s doubt for long enough and look for investors to shift to a sell-on-rallies stance as Brexit tensions continue to mount.”
Fed’s Kaplan: Not committed to Fed’s next policy move, await incoming economic data
24936 March 30, 2019 00:33 FXStreet Market News
Additional comments from Dallas Fed President Robert Kaplan continue to cross the wires with key quotes, via Reuters, found below.
- U.S. inflation, which is running below the Fed’s 2 pct goal, allows policy makers to be patient.
- Not committed to Fed’s next policy move, await incoming economic data.
- Adaptation of any new inflation framework must be credible.
- U.S. economy more sensitive to interest rate changes than ever before due to high levels of public and private debt.


